
Figure 5.
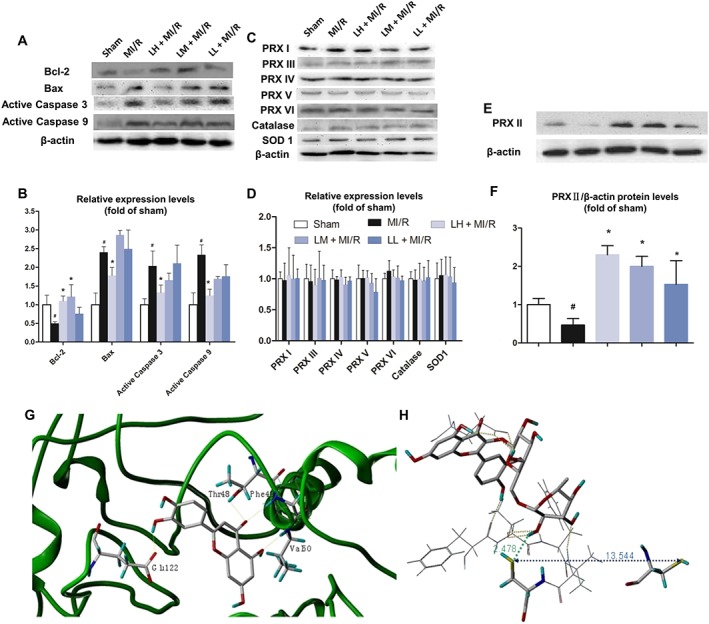
Effect of luteolin on protein levels in cardiac tissue after MI/R in rats. The levels of the apoptosis‐related proteins (Bcl‐2, Bax and active caspases 3 and 9) (A and B), peroxiredoxins (PRX I ‐ VI) and the two representative antioxidant enzymes (catalase and SOD1) (C–F) were measured. Expression levels were normalized against levels of β‐actin, which was used as a loading control. For calculation of relative changes in protein expression, values of individual samples were divided by the mean value of samples from the sham group. In G and H, molecular modelling was used to dock luteolin into the binding pocket of peroxiredoxin II. Data are expressed relative to the mean value for sham group and were presented as mean ± SD (n = 5). # P < 0.05, significantly different from sham group; *P < 0.05, significantly different from MI/R group.