
Figure 7.
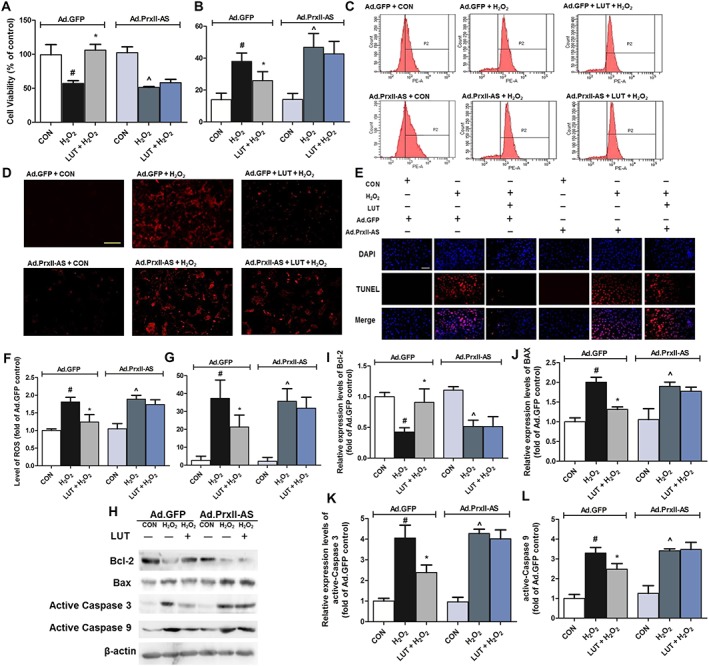
Peroxiredoxin II mediated the protective effect of luteolin on H2O2‐induced oxidative stress in H9c2 cardiomyocytes. Cells were treated in the presence or absence of luteolin (20 μM) and exposed to H2O2 (250 μM) for 2 h after 48 h Ad.GFP or Ad.Prx II‐AS infection. Thereafter, cell viability (A), LDH release (B) and intracellular ROS generation were measured using the DHE assay (200×, bar = 400 μm) (C and D). Additionally, cardiomyocytes were treated in the presence or absence of luteolin (20 μM) and exposed to H2O2 (250 μM) for 2 h after 48 h viral infection (Ad.GFP or Ad.Prx II‐AS). Apoptotic cells were examined under a fluorescence microscope after TUNEL staining (400×, bar = 200 μm) (E). (F) and (G) show quantitative analysis of the results of intracellular ROS and apoptosis respectively. Total number of cells in a given area was determined by DAPI nuclear staining. The apoptotic index was determined as the number of DAPI‐stained TUNEL‐positive cells counted. Microscopic images are representative of five independent experiments. Protein levels of apoptosis‐related proteins (Bcl‐2, Bax and active caspases 3 and 9) were also assayed (H–L). Protein expression levels were normalized against levels of β‐actin, which was used as a loading control. For calculation of relative changes in protein expression or ROS level, values of individual samples were divided by the mean value of samples from the Ad.GFP+ CON group. Data are means ± SD (n = 5). # P < 0.05, significantly different from Ad.GFP + CON (control cells infected by Ad.GFP). *P < 0.05, significantly different from Ad.GFP + H2O2 (Ad.GFP‐infected cells treated with H2O2). ^P < 0.05, significantly different from Ad.Prx II‐AS + CON (control cells infected by Ad.Prx II‐AS).