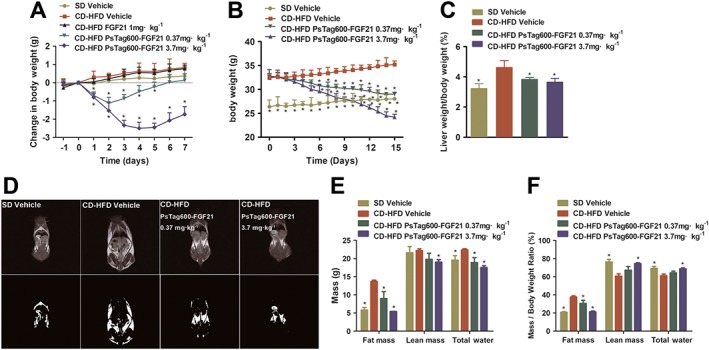
Figure 1.

Physiological effects of PsTag600‐FGF21 in CD‐HFD‐induced NASH mice. (A) Body weight change was measured daily for 7 days. NASH mice were injected i.p. with a single dose on day 0 (n = 8 per group). (B) In a 15 day pharmacological study, body weight was monitored every day (n = 10 per group). (C) Liver weight/body weight (%) of mice after 15 days of treatment. (D) T 1‐weighted MRI images (top) and the fat highlight images (bottom) of mice were shown. (E) Body compositions were analysed. (F) Change in body composition adjusted to body weight. Data shown are means ± SD. *P < 0.05, significantly different from vehicle‐treated NASH mice).
