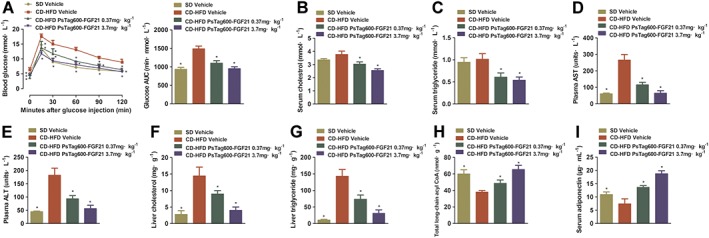
Figure 2.

Effects on glucose tolerance, levels of hormones and metabolites. (A) For OGTT, blood glucose and the glucose AUC from 0 to 120 min were measured. (B) Serum cholesterol. (C) Serum triglyceride. (D) Plasma AST. (E) Plasma ALT. (F) Liver cholesterol. (G) Liver triglyceride. (H) Liver total long‐chain acyl CoA. (I) Serum adiponectin. Data shown are means ± SD (n = 10 per group). *P < 0.05, significantly different from vehicle‐treated NASH mice.
