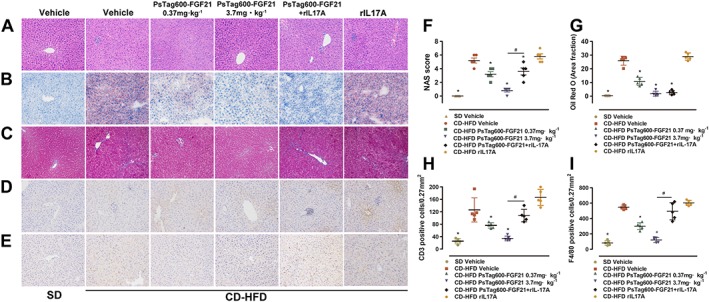
Figure 3.

Tissue histological and immunohistochemical analyses. Representative histology and IHC on liver sections after the treatment of PsTag600‐FGF21, PsTag600‐FGF21 (3.7 mg·kg−1) + rIL17A or rIL17A. From A to E: H&E, Oil‐red‐O, Masson, CD3 and F4/80 (200× magnification). (F) NAS. (G–I) Quantification analysis of Oil‐red‐O, CD3 and F4/80 using image analytical software Image‐pro plus 6.0 (Media Cybernetics, Inc., Rockville, MD, USA). Data shown are means ± SD (n = 5 per group). *P < 0.05 significantly different from vehicle‐treated NASH mice. # P < 0.05, significantly different from PsTag600‐FGF21‐treated NASH mice.
