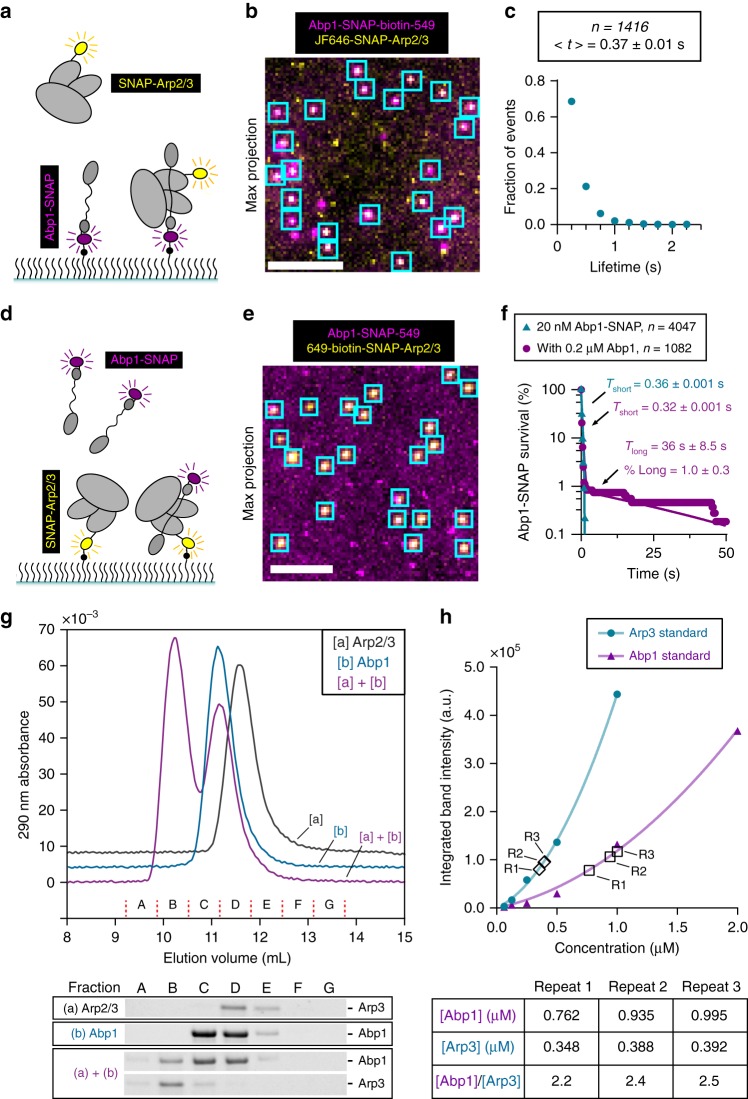
Fig. 3.
Stoichiometry and dynamics of Abp1 interactions with Arp2/3 complex. a Schematic of experimental setup for measuring interactions between labeled Arp2/3 complex and surface tethered labeled Abp1 molecules. b Abp1-SNAP-biotin-549 (magenta) molecules were streptavidin-anchored to the surface, then free JF646-SNAP-Arp2/3 molecules (yellow) were flowed in, and binding events were monitored at 0.25 s intervals for 60 s. Image is a representative maximum projection overlay of the two channels, with cyan boxes marking selected sites of colocalization. Scale bar, 5 µm. c Lifetime distribution of JF646-SNAP-Arp2/3 molecules binding to anchored Abp1-SNAP-biotin-549 for n = 1416 binding events from two trials. Average lifetime, <t>, with s.e.m. d Schematic of experimental setup with anchored 649-biotin-SNAP-Arp2/3 complex molecules and Abp-SNAP-549 molecules. e 649-biotin-SNAP-Arp2/3 complex (yellow) was streptavidin-anchored, and then free Abp1-SNAP-549 molecules (magenta) were flowed in, and binding was monitored at 0.25 s intervals for 120 s. Image is a representative maximum projection overlay, as in (b). Scale bar, 5 µm. f Cumulative survival of Abp1-SNAP-549 molecules bound to anchored 649-biotin-SNAP-Arp2/3 complex spots in the absence (cyan) and presence (magenta) of 0.2 µM unlabeled Abp1. Lifetimes were fit by single or double exponentials as in Fig. 1e, yielding the indicated fit parameters with s.e. from n = 10,000 bootstrap samples. g Size exclusion chromatography profiles for 0.7 µM Arp2/3 complex [a], 7 µM Abp1 [b], or both mixed. Chromatograms are vertically offset slightly for clarity. Fractions are indicated by capital letters. Below the traces are Arp3 and Abp1 bands from ‘stain-free’ gels of the same fractions (see Supplementary Figure 3a for complete gel). h Integrated fluorescence intensity from stain-free gel bands of known amounts of Arp2/3 (circles) or Abp1 (triangles). Data were fit with trendlines (shown) to a second-order polynomial, forced through zero. These curves were used to infer concentration from the integrated intensities of Arp3 and Abp1 bands in the peak fractions of the complex in three technical repeats (R1, R2, R3), marked by hollow diamonds (Arp3) or hollow squares (Abp1). Calculated concentrations and stoichiometry are summarized in the table

