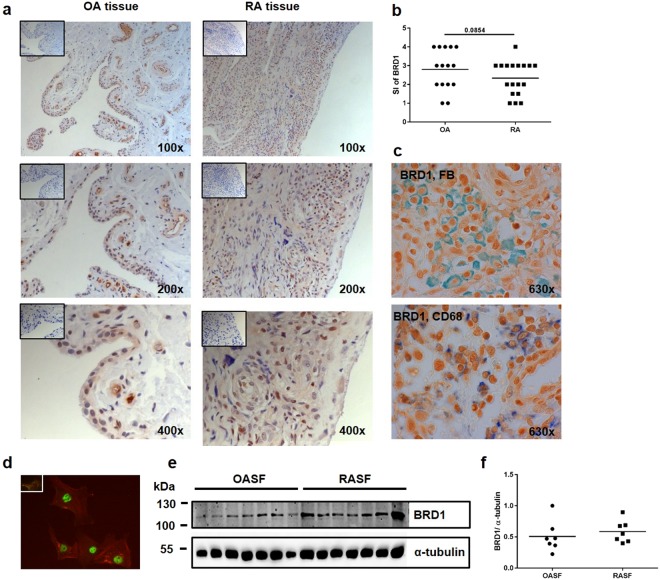
Figure 1.
Synovial expression of BRD1. (a) Synovial tissues from OA and RA patients were stained with anti-BRD1 (brown) antibodies or isotype control (box). Nuclei were counter stained with hemalaun (blue). Representative pictures are shown from one RA patient (elbow) and one OA patient (shoulder); please see also Supplementary Fig. S1. (b) Staining intensities (SI) in OA (n = 15) and RA (n = 18) tissues were scored (1: little staining – 4: strong staining) and difference was analysed by t-test. (c) Synovial tissues were double stained with anti-BRD1 (brown) antibodies and anti-CD68 antibodies (blue) or antibodies against prolyl 4-hydroxylase beta, a fibroblast marker (FB, green). Representative pictures are shown from one RA patient (elbow). (d) Cultured RASF were stained with anti-BRD1 (green) antibodies or isotype control (box). Actin fibres were stained with phalloidin (red). (e) The protein expression of BRD1 in OASF (n = 7) and RASF (n = 7) was analysed by Western blotting. The expression of α-tubulin was used as an endogenous control. Full-length blots are presented in Supplementary Fig. S2. (f) Band intensities of Western blots were analysed by densitometry.

