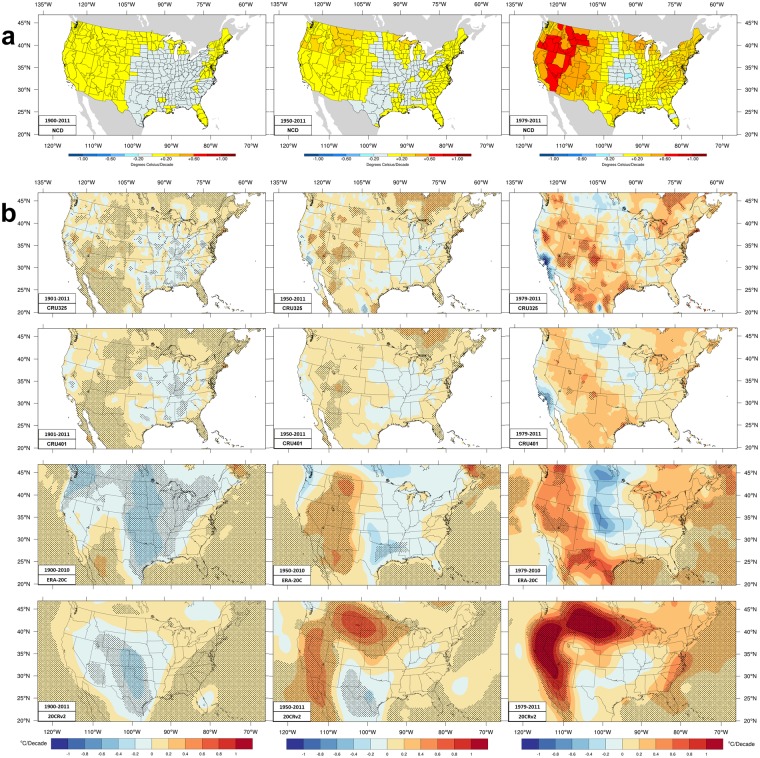
Figure 1.
Trends in summer maximum temperature. Color shading denotes the indicated ranges of June-August (JJA) mean maximum temperature trends during three time periods. The longer time periods are on the left column, the intermediate time periods are the center column, the shorter time periods are the right column. Shading denotes data passing a Mann-Kendal significance test at the 5% level. (a) Trends in NCD monthly mean data. (b) Trends in CRU (CRU325 and CRU401) and the two long-term reanalyses (ERA-20C and 20CRv2) daily data. The units are K/decade.

