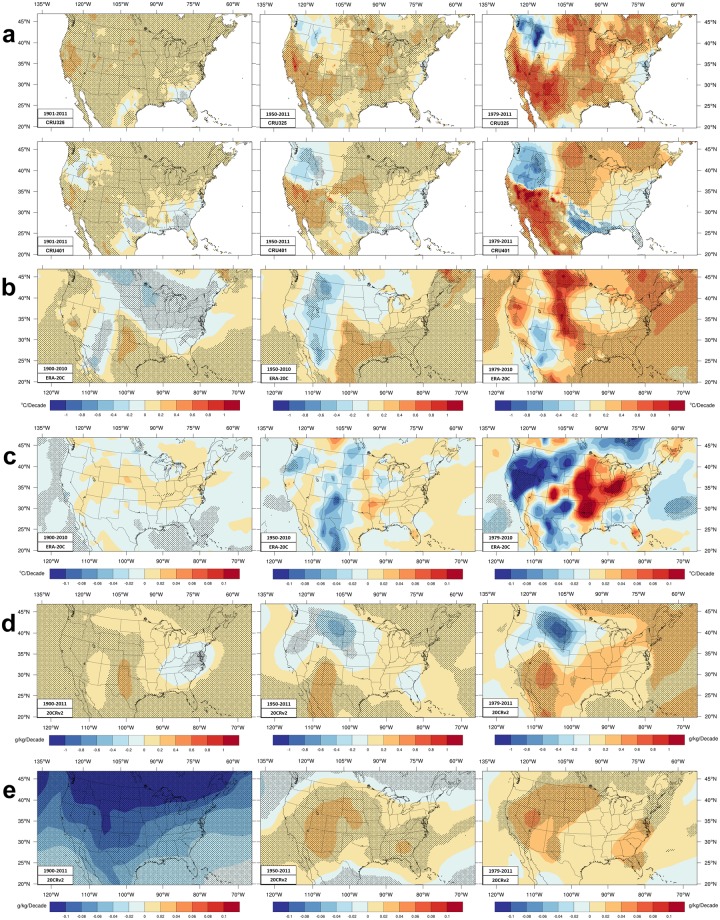
Figure 3.
Trends of daily mean moisture variables. Similar format as Fig. 1 with three columns, each for a different time period. (a) Trends in seasonal (JJA) averages of daily mean dew point (Td). (b) Trends in seasonal averages of daily maximum Td in ERA-20C data. (c) Trends in the standard deviation of ERA-20C ensemble seasonal means of Td. The color scales for (a–c) are K/decade. (d) Specific humidity trends in 20CRv2 and (e) corresponding trend in standard deviation among ensemble members where the color scale shows the change per decade of gm water vapor per kg of air.

