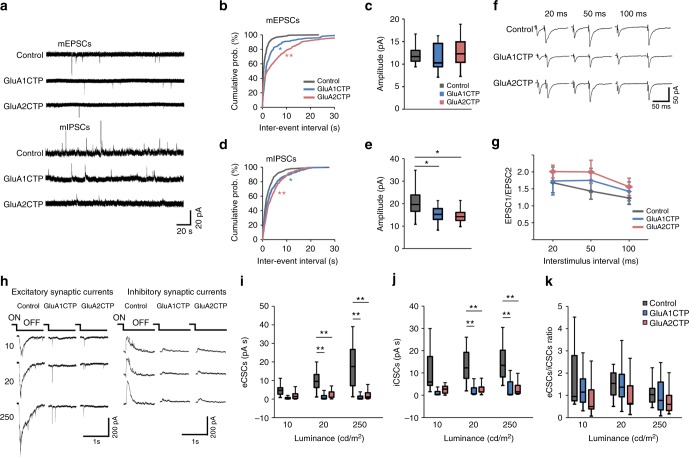
Fig. 1.
GluACTP expression reduced both spontaneous and evoked excitatory and inhibitory synaptic transmission in tectal neurons. a Representative traces of mEPSCs and mIPSCs from neurons expressing EGFP only (Control), GluA1CTP, and GluA2CTP, respectively. b Expression of GluA1CTP or GluA2CTP significantly increased inter-event intervals (IEIs) of mEPSCs in tectal neurons. *P < 0.05, **P < 0.01. Kolmogorov–Smirnov test. c Amplitudes of mEPSCs were not significantly affected by GluA1CTP or GluA2CTP expression. Control: n = 14; GluA1CTP: n = 13; GluA2CTP: n = 15. d, e Cumulative distributions (d) and amplitudes (e) of mIPSCs showing GluA1CTP or GluA2CTP expression significantly increased IEI and decreased amplitudes of mIPSCs compared to control neurons. *P < 0.05, **P < 0.01. Kolmogorov–Smirnov test or ANOVA with Newman–Keuls posthoc test. f Representative recordings of EPSCs in response to paired stimuli 20, 50, and 100 ms apart from neurons in each experimental group. Stimulus artifact was clipped for clarity. g Paired pulse ratios of EPSC2/EPSC1 were not significantly different between control, GluA1CTP-, and GluA2CTP-expressing neurons. Scale bar: 20 pA, 20 ms. Control: n = 7; GluA1CTP: n = 5; GluA2CTP: n = 5. h Representative traces for visually evoked excitatory CSCs (eCSCs) and inhibitory CSCs (iCSCs) in control, GluA1CTP-, and GluA2CTP-expressing neurons in response to full-field light off visual stimuli at intensities of 10, 20, and 250 cd cm−2. i, j Summary data showing that eCSCs (i) and iCSCs (j) in GluA1CTP- and GluA2CTP-expressing neurons are significantly decreased compared to control neurons in response to visual stimuli of 20 and 250 cd cm−2 respectively. Control: n = 7; GluA1CTP: n = 7; GluA2CTP: n = 7. k The ratio of eCSCs to iCSCs in GluA1CTP- and GluA2CTP-expressing neurons remained comparable to control neurons in response to visual stimulation of all luminances tested. ANOVA with Newman–Keuls posthoc test. We record tectal neurons blind to neurotransmitter type. Approximately 70% of tectal neurons are excitatory neurons, therefore the electrophysiological results most likely reflect changes in the excitatory neurons. For boxplots in this and following figures, the box represents the 25th and 75th percentiles of the samples. The center line represents the median and whiskers depict the full range of observations

