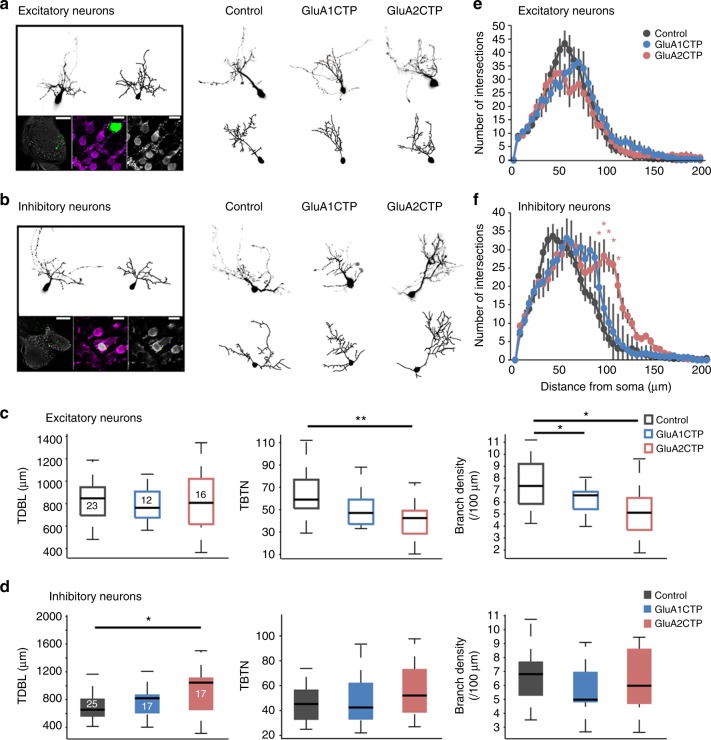
Fig. 3.
GluACTPs differentially affect dendritic arbor growth in excitatory and inhibitory neurons. a, b Representative images of excitatory (a) and inhibitory (b) neurons. Left panel: Example of the live image and reconstructed full dendritic arbor of an individual neuron (top). Post hoc GABA immunolabeling (bottom) of the same neuron. Green, GFP; gray/magenta, GABA. Scale bar: left 100 μm; middle and right 10 μm. Right panel: Representative live images (top) of inhibitory neurons expressing GFP only (control), GluA1CTP, or GluA2CTP, and reconstructed complete dendritic arbors (bottom). c, d Summary data of total dendritic branch length (TDBL), total branch tip number (TBTN), and branch density control, GluA2CTP- and GluA1CTP-expressing excitatory (c) and inhibitory (d) neurons. *P < 0.05, Kruskal–Wallis test with post hoc Mann–Whitney U test. Number of neurons in each group is shown in the graph. e, f Sholl analysis: neither GluA1CTP nor GluA2CTP affected dendritic arbor branching pattern in excitatory neurons (e). GluA2CTP but not GluA1CTP significantly increased branch density distal to the soma in inhibitory neurons (f) compared to controls. *P < 0.05, **P < 0.01, Kruskal–Wallis test with post hoc Mann–Whitney U test

