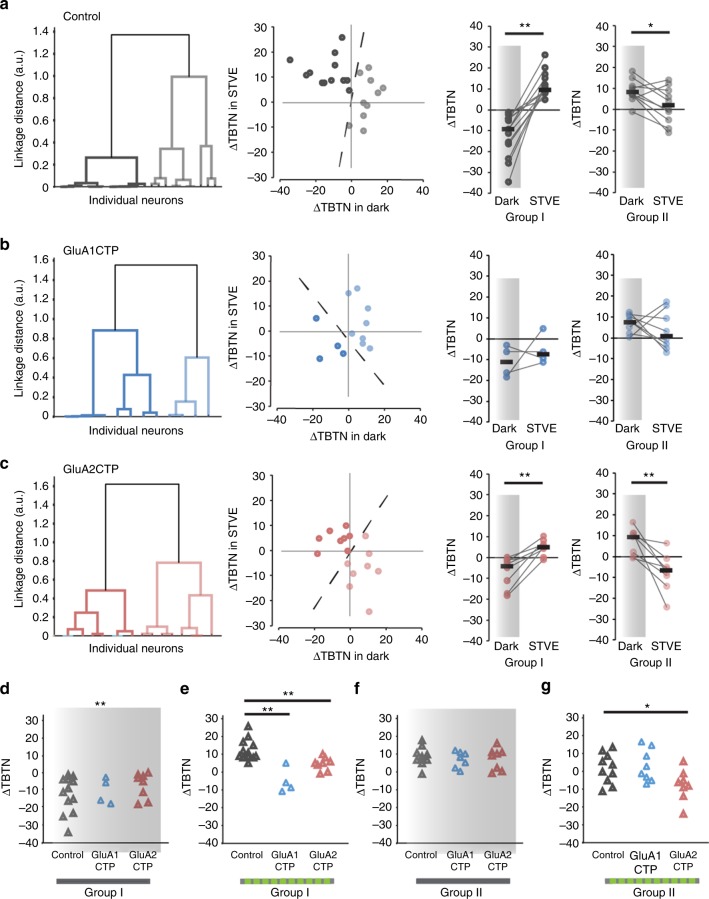
Fig. 6.
Cluster analysis of experience-dependent changes in TBTN in individual excitatory neurons. a Left: Dendrogram of unsupervised hierarchical cluster analysis of control excitatory neurons based on ΔTBTN in STVE versus dark. Middle: Scatter plots of ΔTBTN in response to STVE versus dark in individual neurons for Group I and II excitatory neurons. Right: Summary of ΔTBTN in dark and STVE for Group I and II control neurons. b Cluster analysis of GluA1CTP-expressing excitatory neurons. c Cluster analysis of GluA2CTP-expressing excitatory neurons. *P < 0.05, **P < 0.01, Wilcoxon sign rank test. d- g Summary data of ΔTBTN in response to dark (d, f) and STVE (e, g) in group I (d, e) and group II (f, g) excitatory neurons. *P < 0.05, Kruskal–Wallis test with post hoc Mann–Whitney U test

