Fig. 7.
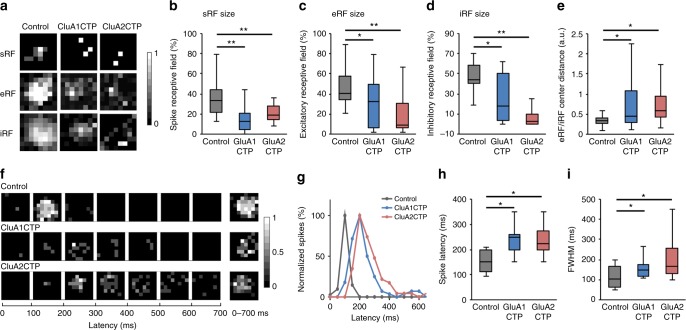
GluACTP expression disrupts spatial and temporal receptive visual field properties. a Representative maps of spiking RFs (sRFs), excitatory RFs (eRFs), and inhibitory RFs (iRFs) in control, GluA1CTP- and GluA2CTP-expressing neurons. b-d Both GluA1CTP and GluA2CTP expression significantly decreased the size of sRF (b, n = 28, 14, 8), eRF (c, n = 18, 19, 20), and iRF (d, n = 18, 12, 13). e The distances between eRF and iRF centers were significantly larger in GluA1CTP- and GluA2CTP-expressing neurons. f Representative tRF maps in control, GluA1CTP- and GluA2CTP-expressing neurons. g Plot of spike numbers over the 700 ms recording period normalized to peak spike numbers per 100 ms bin. The control tRF is limited to the first 200 ms while tRFs in GluA1CTP- and GluA2CTP-expressing neurons were significantly extended and delayed. h, i Both spike latency (h) and the full width at half maximum (FWHM, i) of the tRF spiking response increased significantly in GluA1CTP- and GluA2CTP-expressing neurons compared to control neurons. Control: n = 12; GluA1CTP: n = 9; GluA2CTP: n = 8. *P < 0.05, **P < 0.01. ANOVA with Newman–Keuls test

