Figure 2.
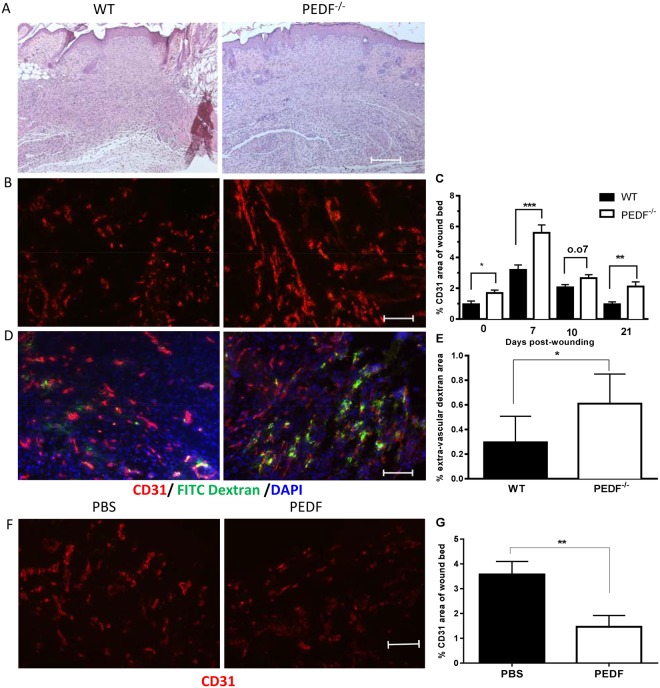
Capillary content and permeability in WT, PEDF−/− or PEDF treated mice. (A) Representative photomicrographs of the histology of day 7 wound (H&E staining). Skin wounds in both groups closed at day 7. (B) Representative fluorescence photomicrographs of CD31 staining in wounds. Scale bar = 100μm. (C) Wound vascularity, quantified by measuring the percent area of wound bed occupied by CD31 staining. Mean ± SD, n = 5 for normal unwounded skin (NS)- WT, Day 10- WT, Day 21- WT and Day 21- PEDF−/−; n = 6 for Day 7- PEDF−/− and Day 10- WT; n = 7 for NS- PEDF−/− and Day 10- PEDF−/−; *p < 0.05 versus NS, **p < 0.01, ***p < 0.001 by two-way ANOVA and Bonferroni’s post-tests. (D) Vascular permeability in day 7 wounds of PEDF−/− and WT mice following perfusion with FITC-dextran 30 min before wound harvest. Representative fluorescence photomicrographs of CD31 (red) and dextran (green) staining. (E) Blood vessel permeability quantified as the percent area of extra-vascular dextran (dextran not co-localized with CD31) in the wound bed at day 7 after injury. Mean ± SD; n = 5 for WT mice and n = 6 for PEDF−/−. *p < 0.05 by Student t-test. (F,G) Effect of exogenous PEDF treatment on wound vascularity. (F) Representative fluorescence photomicrographs of CD31 staining in day 10 wounds after PEDF treatment. Scale bar = 100μm. (G) Quantification of wound vascularity at day 10, measured as percent area of wound bed occupied by CD31 staining. Mean ± SEM, n = 5 for both groups, **p < 0.01 by Student t-test.

