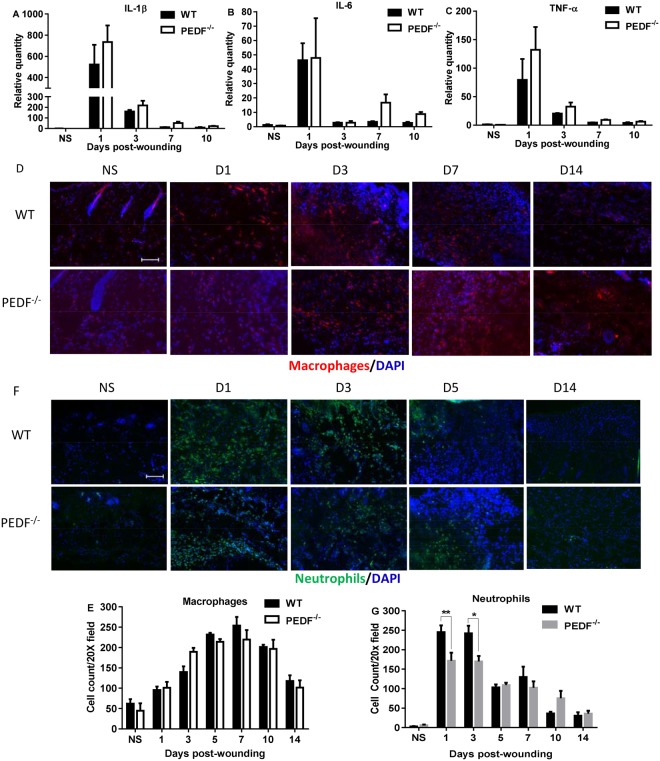
Figure 3.
Analysis of inflammatory cytokine expression and immune cell content in wounds of PEDF−/− and WT mice. (A–C) Levels of mRNA expression of the inflammatory cytokines IL-1β, IL-6, and TNF-α. Mean ± SEM; n = 5 in all groups and at all time points except n = 4 for WT Day 3 and PEDF−/− Day 7. (D) Representative images of macrophage (CD68) staining at selected time points in wounds of PEDF−/− and WT mice. (E) Macrophage cell counts in wounds of PEDF−/− and WT mice. Mean ± SD; n = 3 for WT Days 5 &14 and PEDF−/− Day 5; n = 4 for WT Day 3 and PEDF−/− Day 7; n = 5 for WT NS, Days 7&10, and PEDF−/− Days 1, 3 &14; n = 6 for WT Day1 and PEDF−/− NS and Day 10. (F) Representative images of neutrophil (Gr-1) staining at selected time points in wounds of PEDF−/− and WT mice. (G) Neutrophil cell counts in wounds of PEDF−/ and WT mice. Mean ± SD; n = 3 for WT Days 5 &14; n = 4 for WT Day 3 and PEDF−/− Days 5 &10; n = 5 for WT Days 7&10 and PEDF−/− Days 7 &14; n = 6 for WT NS; n = 7 for WT Day 1; n = 8 for PEDF−/− NS & Day 1; n = 10 for PEDF−/− Day 3. *p < 0.05 and **p < 0.01 by two-way ANOVA followed by Bonferroni’s post-hoc analysis. Scale bar = 100 µm.

