Figure 3.
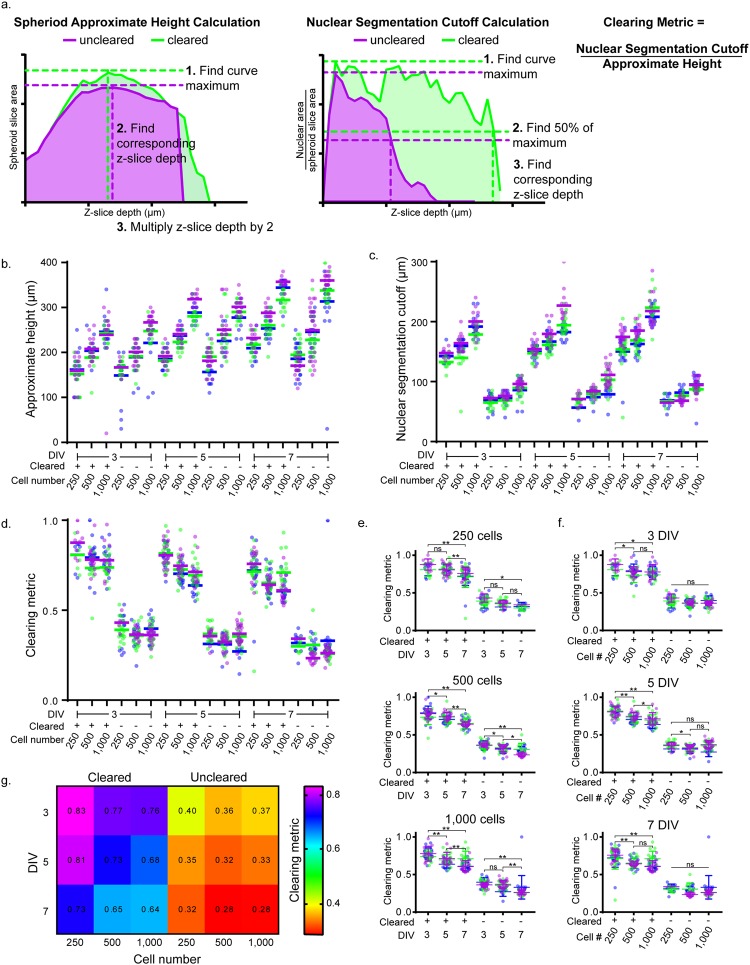
Assessment of clearing and segmentation analysis in T47D spheroids. (a) Approximate spheroid height, nuclear segmentation cutoff, and clearing metric calculations. Calculation steps are demonstrated using example uncleared and cleared 3 DIV 250 cell spheroids. Spheroid slice area was calculated using the segmented whole spheroid. Nuclear area was calculated by adding together the areas of each segmented nuclei within a slice. Approximate height (b), nuclear segmentation cutoff (c), and clearing metric (d) were calculated for three independent experiments for T47D spheroids at 3, 5, and 7 DIV and with 250, 500, 1,000 cells seeded per spheroid, for both cleared and uncleared conditions. Data points represent individual spheroids, colors represent independent experiments, and horizontal bars represent averages for independent experiments. Clearing metric data is separated to see the effect of culture time on spheroids of a single size (e) and the effect of spheroid size on spheroids of a single age (f) For (e and f) two-way ANOVA with Tukey post-hoc multiple comparisons were performed. Error bars represent SD, **P < 0.0001, *P < 0.05, ns = not significant. The number of spheroids analyzed for (b–g) can be found in Supplementary Table 2. (g) Heat map displays the clearing metric results, showing the average for each condition.

