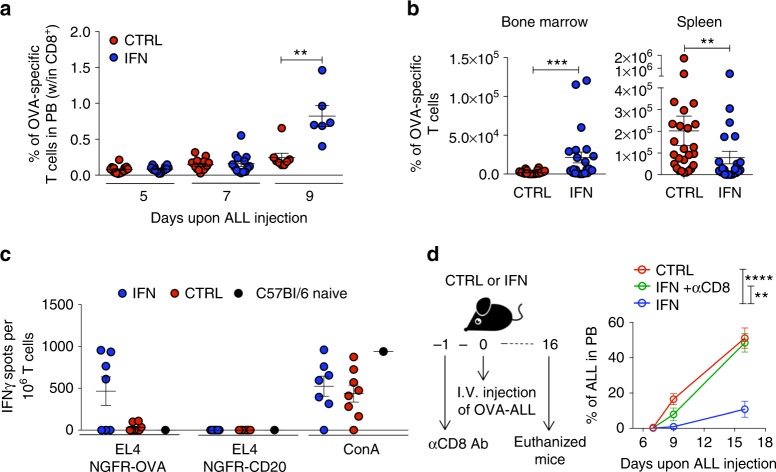
Fig. 2.
IFN gene therapy activates adaptive immunity. a Percentage (mean ± SEM) of OVA-specific T cells in the PB of IFN (n = 14–6) and CTRL (n = 15–8) mice. **p < 0.01, Mann Whitney performed at 9 days upon OVA-ALL injection. Each dot represents a mouse (one out of five experiments is shown). b Absolute numbers (mean±SEM) of OVA-specific T cells in the BM and spleen, 9 days upon tumor injection, in IFN (n = 23) and CTRL (n = 26) mice from 3 independent experiments. **p < 0.01, ***p < 0.001, Mann–Whitney. Each dot represents a mouse. c Splenic CD8+ T cells from IFN (n = 7) and CTRL (n = 8) mice 9 days upon tumor injection or from non tumor-bearing mice tested by IFNγ-ELISPOT against the EL4 target cell line transduced with NGFR-OVA or NGFR-hCD20 bidirectional LV. Concanavalin A (ConA) stimulation is used as positive control. Each dot represents a mouse. d Experimental design and percentage (mean±SEM) of OVA-ALL in the PB of IFN (n = 9), CD8-depleted IFN (n = 7) and CTRL (n = 9) mice. **p < 0.01, ****p < 0.0001, nonparametric rank-based method for longitudinal data in factorial experiments

