Fig. 4.
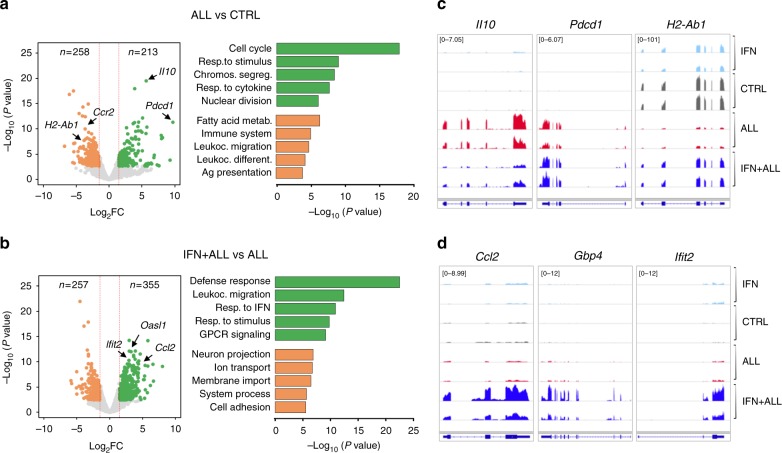
Transcriptional reprogramming of tumor-associated macrophages by IFN gene therapy. a, b Volcano plots (left panels) showing differentially expressed genes (abs. log2FC > 1.5, FDR < 0.05) up-regulated (green) or down-regulated (orange) in splenic macrophages from tumor-bearing (ALL) vs. control (CTRL) mice (a) or ALL mice treated (IFN+ALL) or not (ALL) with IFN gene therapy (b). Bar plots (right panel) show GO terms enriched in up-regulated (green) or down-regulated (orange) genes from the indicated comparisons. c, d Selected RNA-Seq snapshots of deregulated genes in macrophages from ALL mice (c) or ISGs induced in IFN+ALL mice (d)

