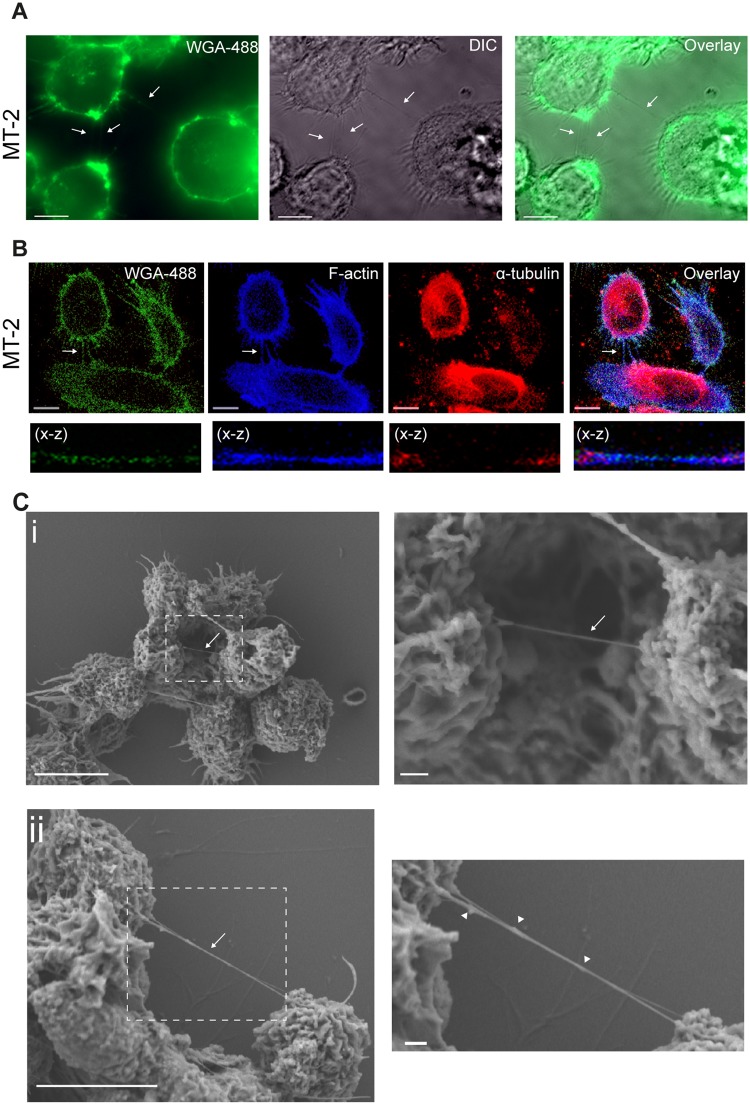
Figure 1.
HTLV-1 expressing cells form tunneling nanotubes (TNTs). (A) MT-2 cells stained with WGA-488 (cellular membranes, green) and investigated by fluorescence microscopy. Arrows indicate thin membrane embedded intercellular connections. (B) MT-2 cells stained with WGA-488 (green), F-actin phalloidin-AF350 (blue) and an anti-α-tubulin antibody (red) and analyzed by confocal microscopy. Arrows indicate a TNT. The X-Z plane is obtained from a Z-stack (total 24 slices of 1 µm each). (C) Scanning electron microscopy (SEM) of MT-2 cells connected by TNTs. Zoomed images to the right. Arrows indicate TNTs, arrowheads indicate bulges in TNTs. Images were captured by scanning electron microscope Jeol JSM-7400F LEI 4.0 kV, x3000 (x3700 for D2) and WD 8.0 mm. Confocal microscopy images were acquired by LSM780 confocal microscope (Zeiss) and fluorescence microscopy was acquired by AxioObserver Z1 (Zeiss). All images are representatives of three independent experiments, except for (C) that was performed once. All scale bars 10 µm except zoomed SEM images; 1 µm. Adobe photoshop CS6 was used to prepare the images. The contrast was enhanced on the whole image to better represent and visualize the thin TNT structures.

