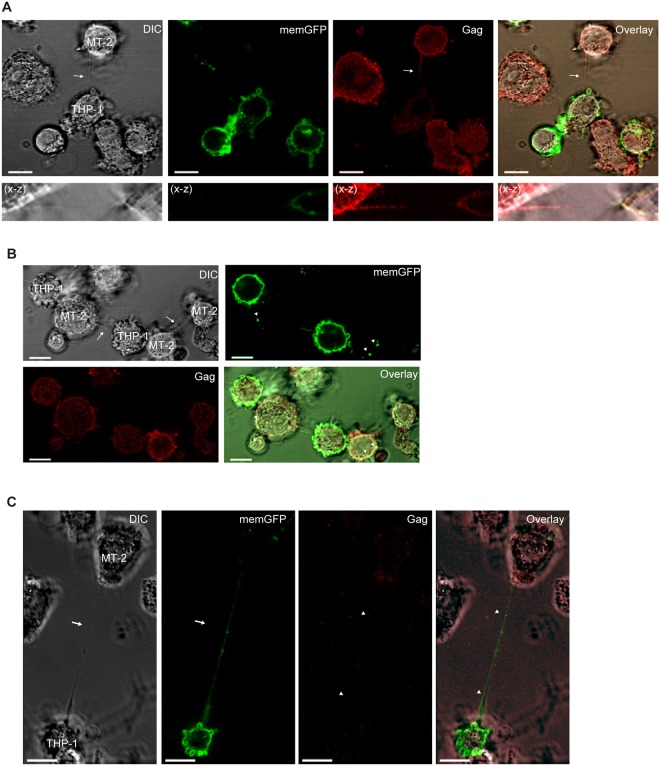
Figure 4.
Gag present in TNT connecting HTLV-1 expressing cells and non-infected monocytes. (A–C) MT-2 cells and THP1-memGFP (green) cells were co-cultured overnight, fixed and stained for p24Gag (red) before investigated for TNT connections by DIC and fluorescent confocal microscopy. Arrows indicate TNTs and arrowheads Gag. The X-Z plane is obtained from a Z-stack (total 23 slices of 1 µm each). Images are representatives of three independent experiments performed in duplicates. Scale bar 10 µm.

