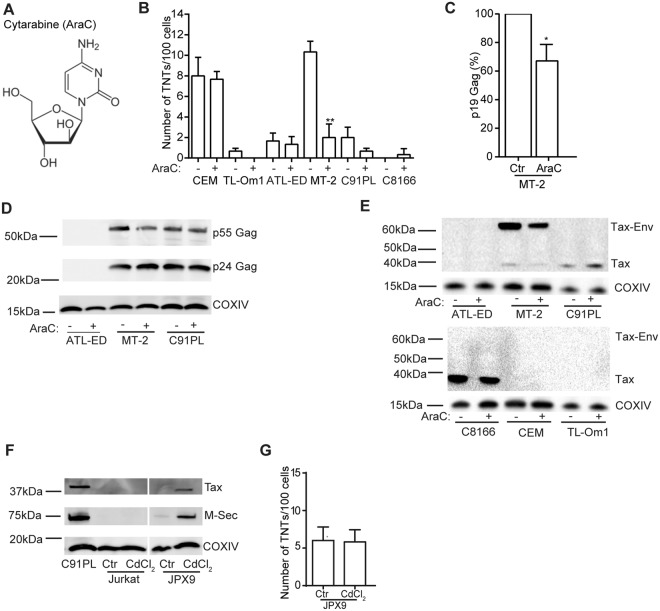
Figure 5.
Cytarabine treatment reduces TNT numbers in HTLV-1 expressing cells. (A) Molecular structure of cytarabine (AraC). (B) Quantification of TNTs in cell lines before and after cytarabine (AraC) treatment (1 µM, 24 h). (C) Quantification of p19 Gag (pg/ml) by the HTLV-1 antigen capturing ELISA kit in MT-2 supernatant before and after treatment with AraC (1 µM, 24 h). (D) Immunoblotting of ATL-ED, MT-2 and C91PL cells before and after treatment with AraC (1 µM, 24 h) with antibodies against p24/p55 Gag and COXIV (loading control). (E) Immunoblotting of C8166, CEM, TL-Om1, ATL-ED, MT-2 and C91PL cells before and after treatment with AraC (1 µM, 24 h) with antibodies against Tax and COXIV (loading control). (F) Immunoblotting of Jurkat and JPX9 (Tax wt) cells, before and after CdCl2 treatment; antibodies against Tax, M-Sec and COXIV (loading control). Lysates of C91PL cells: positive control of Tax and M-Sec expression. Results are representative of three independent experiments. (G) Quantification of TNTs in JPX9 cells before and after treatment with CdCl2. All error bars indicate the mean ± standard deviation. For TNT quantifications; all data are presented as three independent experiments in duplicates, p19 Gag quantifications; all data are presented in percentage as three independent experiments. The immunoblots are representatives of three independent experiments. Unpaired t-test was performed to evaluate statistic significance. F-test was performed for individual variation. GraphPad Prism (Version 6.03) was used (*p < 0.05, **p < 0.01). Scale bars: 10 µm. Full-length immunoblots are presented in Supplementary Fig. 2.

