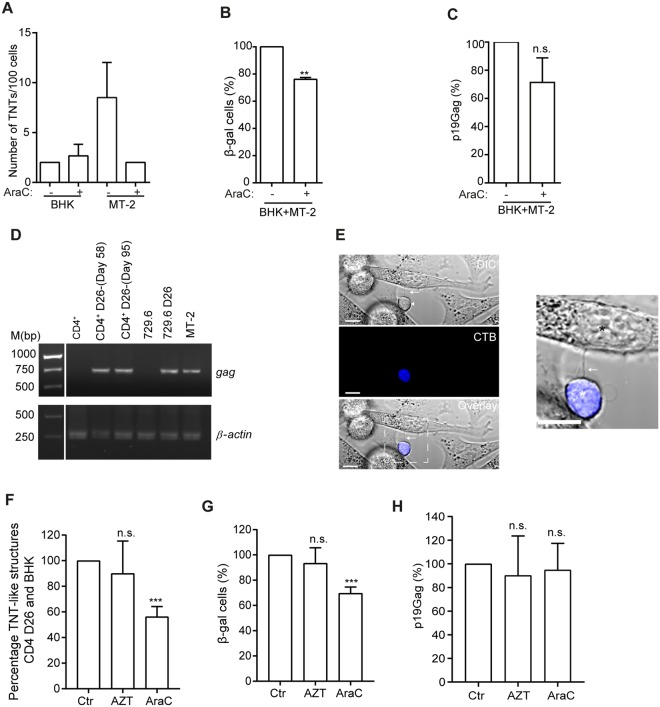
Figure 6.
Cytarabine, but not AZT significantly inhibits viral transmission and TNT-like structures between primary CD4+-pAB-D26 and BHK1E6 cells (A) TNT quantification of BHK1E6 cells (BHK) and MT-2 cells before and after cytarabine (AraC) treatment (1 µM, 24 h). TNTs quantified between mono-cultures of BHK1E6 and MT-2 cells. (B) Co-culture of MT-2 and BHK1E6 (BHK) cells (24 h) with 1 µM AraC or ctr stained for β-galactosidase activity (blue cells), percentage of three independent experiments performed in duplicates. (C) Quantification of p19 Gag (pg/ml) in supernatants of co-culture experiments in (B) by the HTLV-1 antigen capturing ELISA kit (D) Validation of Gag presence in primary CD4+-pAB-D26 cells by PCR, uninfected CD4+ cells and 729.6 cells are shown as negative controls, 729.6-pAB-D26 and MT-2 cells are shown as positive controls. (E) TNT-like structure between cell tracker blue stained CD4+-pAB-D26 in co-culture with BHK1E6 cells, arrow indicate TNT-like structure. In zoomed image black star indicate BHK1E6 cell and white star CD4+-pAB-D26. Image is representative of three independent experiments performed in duplicates. (F) Quantification of TNT-like structures between CD4+-pAB-D26 and BHK1E6 cells co-cultured for 24 h with 10 µM AZT, 1 µM AraC or medium only. 100 CD4+ D26 cells were counted in each experiment. Mean percentage from three independent experiments performed in duplicates are shown. (G) Co-culture of CD4+-pAB-D26 cells and BHK1E6 cells (24 h) with ctr, 10 µM AZT or 1 µM AraC stained for β-galactosidase activity (blue cells), percentage of three independent experiments performed in duplicates. (H) Quantification of p19 Gag (pg/ml) in supernatants of co-culture experiments in (G) by the HTLV-1 antigen capturing ELISA kit. All p19 Gag quantifications are presented in percentage of three independent experiments. All error bars indicate the mean ± standard deviation. Unpaired t-test was performed to evaluate statistical significance. F-test was performed for individual variation. GraphPad Prism (Version 6.03) was used (**p ≤ 0.01, ***p ≤ 0.001, n.s. not significant). Full-length gel images are presented in Supplementary Fig. 4.

