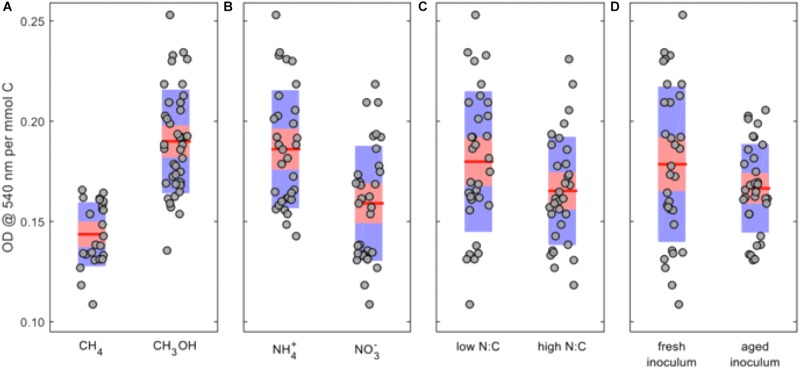
FIGURE 2.
Main-factor effects on normalized OD540 for Methylosinus trichosporium OB3b cultures. (A) C-source; (B) N-source; (C) N:C ratio; and (D) inoculum history. The red lines represent the mean values, the red areas represent the mean ± 1.96 × standard error, and the blue areas represent the mean ± one standard deviation.

