FIGURE 3.
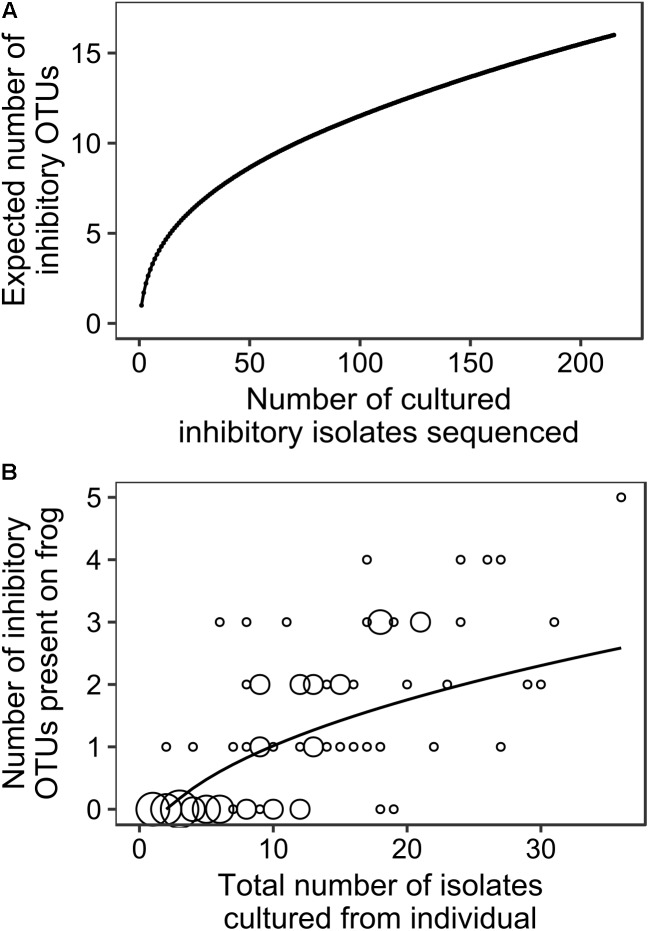
The relationships between (A) the number of totally inhibitory bacterial isolates identified and sequenced and the expected number of totally inhibitory OTUs (EstimateS; Colwell, 2013), and (B) the total number of isolates obtained from each individual frog and the number of totally inhibitory OTUs detected. The size of circles corresponds to the number of frogs at each combination of number of isolates and number of OTUs, with the smallest indicating one individual and the largest indicating eight. The best fit accumulation curve is a power curve fitted to the number of OTUs plus 1 (y = 0.717x0.449 with R2 = 0.505, p = 0.001).

