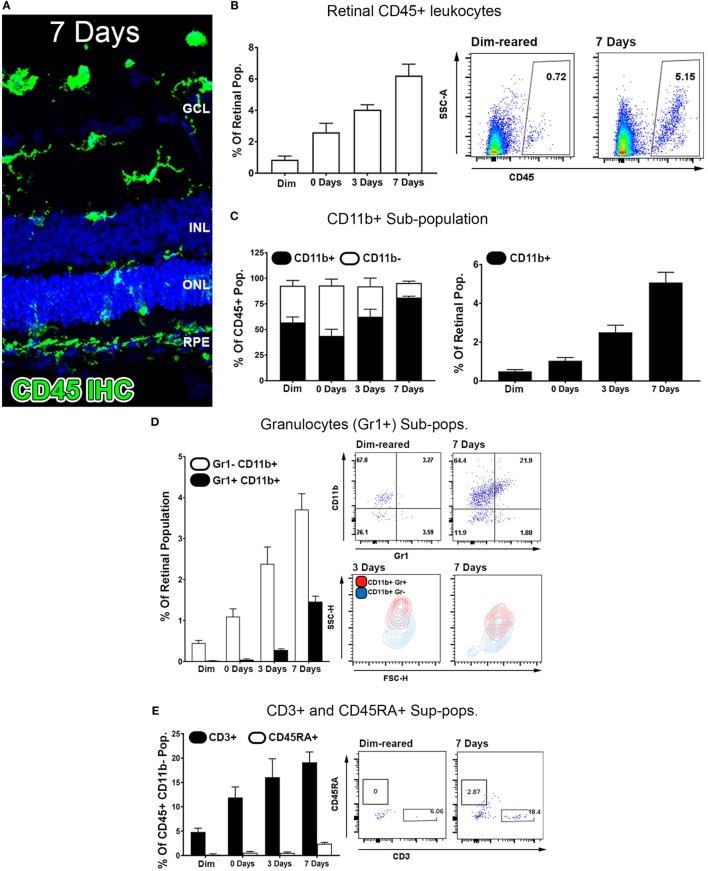
Figure 2.
Characterization of major CD45 leukocyte subsets in the retina following photo-oxidative damage. (A) Representative labeling of CD45+ cells (green) by immunohistochemistry on retinal sections, with DAPI (blue) as the background stain. At 7 days post damage, there were numerous CD45+ cells distributed in the ONL and subretinal space following damage (B,D). (B) Graphing and representative plots for florescence activated cell sorting (FACS) of CD45+ cells, which show progressive increases over time, relative to the retinal population (P < 0.05, ANOVA). (C–E) Categorization of CD45 subpopulations in the retina over the timecourse, using flow cytometry. (C) The proportion of CD11b+ macrophages comprised the bulk of the CD45+ population (F, left, P < 0.05, ANOVA), and continually increased throughout the timecourse relative to the retinal population (F, right, P < 0.05, ANOVA). (D) Graphing and representative plots showcase CD11b and Gr1 staining among CD45 cells, relative to the retinal population. CD11b+Gr1+ granulocytes were found exhibit late increase at 3 and 7 days (ANOVA P < 0.05), comprising a smaller proportion than the CD11b+Gr1− macrophage subset. The representative SSC/FSC plots at 3 and 7 days show increased SSC of CD11b+Gr1+ granulocytes compared to CD11b+Gr1−. (E) Staining for CD3+ T cells and C45RA+ B cells is presented in graphs and representative plots as a proportion of the CD45+CD11b− parent population. The subset of CD3+ cells displayed progressive increase over time, and peaking at 7 days (P < 0.05 ANOVA); CD45RA+ cells in contrast showed no appreciable change across the timecourse. All datasets represent a sample size of n = 4 per group. C, choroid; FACS, fluorescence-activated cell sorting; INL, inner nuclear layer; ONL, outer nuclear layer; OS, outer segments.

