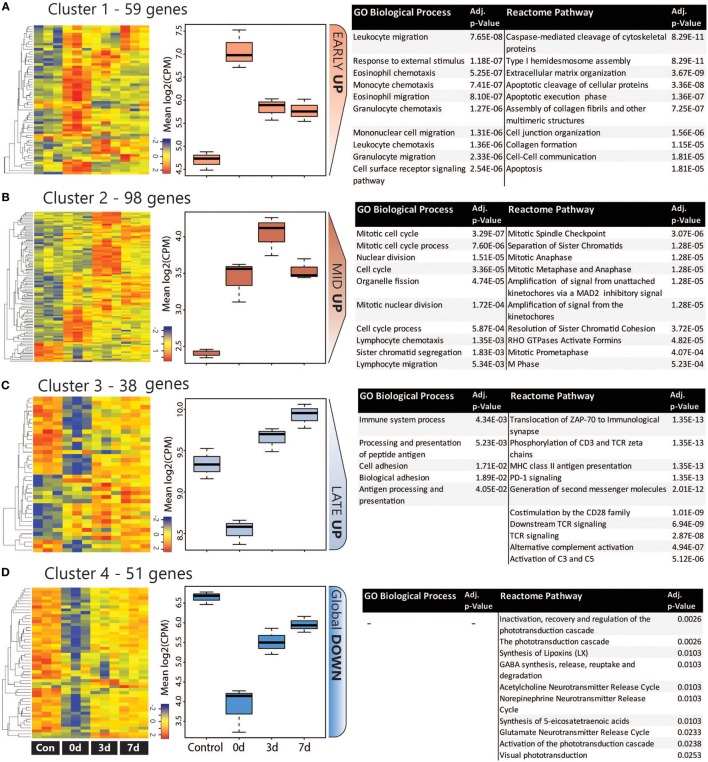
Figure 4.
Analysis of co-regulated DEGs within the CD45 population following photo-oxidative damage. (A–D) K-means clustering was performed on the log2 cpm of 246 DEGs that were derived from the combined top 100 DEGs in each timepoint. Four major clusters were identified, as illustrated in the heat maps and box and whiskers plots, and variously termed (A) Early Up, (B) Mid Up, (C) Late Up, and (D) Global Down, based on their temporal expression pattern. The DEGs in each cluster were assessed for enriched terms and pathways using GO:BP and Reactome, respectively; the top entries for each are displayed, which were ranked according to the adjusted P value. Abbreviations: BP, biological process; DEG, differentially expressed gene; GO, gene ontology.

