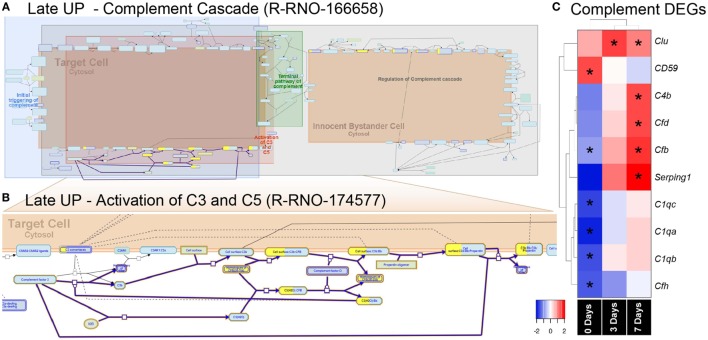
Figure 5.
Enrichment of the complement pathway in the CD45 transcriptome. (A,B) Reactome pathway diagrams showcase overrepresentation [false discovery rate (FDR) <0.05] of complement interactions in the Late UP K-means Cluster. Yellow-coloring in the nodes denotes a gene in the expression list that matches a protein within the pathway diagram, while the degree of coloring represents the coverage. (A) Pathway diagram depicts the entire complement cascade, which are broadly classified subcomponents for initial triggering of complement (blue), terminal pathway of complement (green), activation of C3 and C5 (red), and regulation of the complement cascade (gray). (B) Activation of C3 and C5 was found to show significant enrichment Factor B (cfb) in the expression list (yellow-coloring). (C) Heat maps with hierarchical clustering on significant complement DEGs derived from the full gene expression list (2,193). Asterisks denote significant differential expression (FDR < 0.05) compared to control (dim). Abbreviation: DEG, differentially expressed gene.

