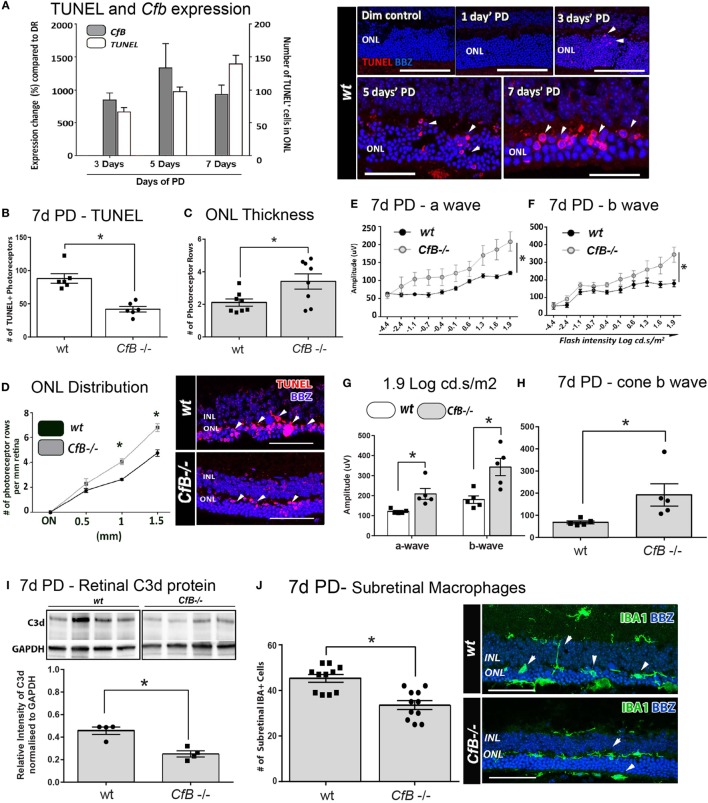
Figure 6.
Effect of Cfb ablation on retinal degeneration complement activation, and macrophage infiltration following PD. (A) Temporal relation of retinal cfb expression and TUNEL + photoreceptor counts PD was assessed in Wt mice after 3, 5, and 7 days PD. The expression of Cfb showed continual upregulation following PD, compared to dim-reared (P < 0.05) and was in concert with increase in TUNEL + photoreceptors (P < 0.05). Representative florescent images showcase TUNEL staining (red) over the timecourse of PD. (B–D) Change in TUNEL-photoreceptor counts and ONL thickness in Wt vs Cfb−/− mice, after 7 days PD. TUNEL+ across the full length of retinal sections were quantified and found to be reduced in Cfb−/− mice [(B), P < 0.05]; these are depicted in representative images. ONL thickness was extrapolated on the same sections as function of the number of photoreceptor rows (C,D). When quantified over sections (C), there were more surviving photoreceptors in Cfb−/− mice, compared to Wt (P < 0.05), and was particularly pronounced in mid-periphery [~1 to 1.5 mm eccentricity (D)]. (E–H) ERGs recordings capture a flash intensity series (−4.4 to 1.9 cd.s/ms2) conducted on Wt and Cfb−/− cohorts after 7 days PD. The trend for both analyzed b- and b-waves across this series was higher Cfb mice than Wt (E,F), in addition to highest flash intensity [(G), P < 0.05]. The cone-derived b wave was analyzed at from a twin-flash stimulus at 1.9 cd.s/ms2 and was also significantly higher in the Cfb−/− cohort [(H), P < 0.05]. (I) Representative immunoblots illustrate bands for complement C3d protein and loading control GAPDH in whole retinas, from CfB−/− and WT cohorts after 7 days PD. Densitometry quantified C3d levels, normalized to GAPDH, and indicated reduced C3d levels in the Cfb−/− cohort (P < 0.05). (J) Immunohistochemistry for IBA1 + macrophages/microglia (green) in retinal sections of Wt vs Cfb−/− mice after 7 days PD, as shown in representative images. The graph illustrates the quantification of IBA1+ cells in the ONL and subretinal space across retinal sections and show a significant decrease in the Cfb−/− cohort, compared to Wt (P < 0.05). Statistical significance was determined by Student’s t-test or ANOVA accompanied with post hoc multiple comparison (*P < 0.05). (A–H): N = 5 per group; (I–J): N = 4 and 11 per group. Abbreviations: ERG, electroretinogram; INL: inner nuclear layer; ONL: outer nuclear layer; PD, photo-oxidative damage. Scale bars equal to 50 µm.

