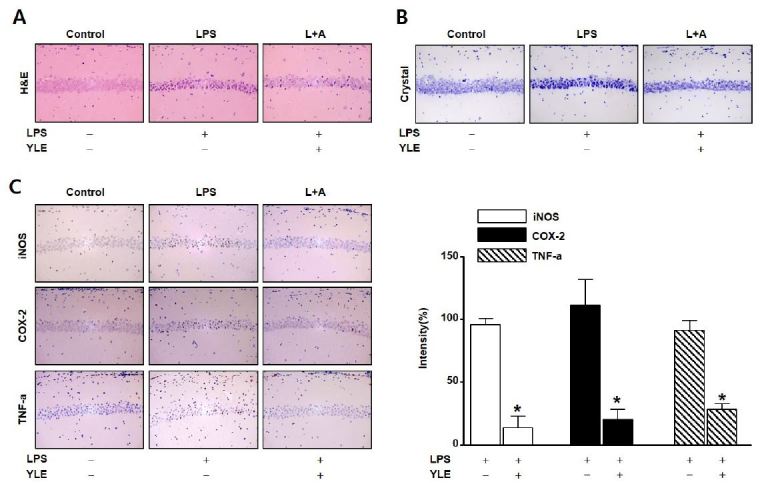
Fig. 3. Histological analysis of hippocampus following lipopolysaccharide (LPS)-induced neuroinflammation. LPS (250 μg/kg) was injected intraperitoneally into male ICR mice. Brains were sectioned after 7 days. pHpiocampus morphology was analyzed using hematoxylin and eosinA () and cresyl violet (B ) staining. (C) The inflammatory factors inducible nitric oxide synthase (iNOS), cyclooxygenase (COX)-2, and tumor necrosis factor (TNF)-α were detected using immunohistochemical staining in cross-sections. Bar graphs quantitate the intensity of the brown color representing the expression of iNOS, COX-2, and TNF-α. Protein expression in the LPS alone group is considered 100%. Data are expressed as means ± SE (n = 3). *Significant difference compared with the LPS alone group (p < 0.05).

