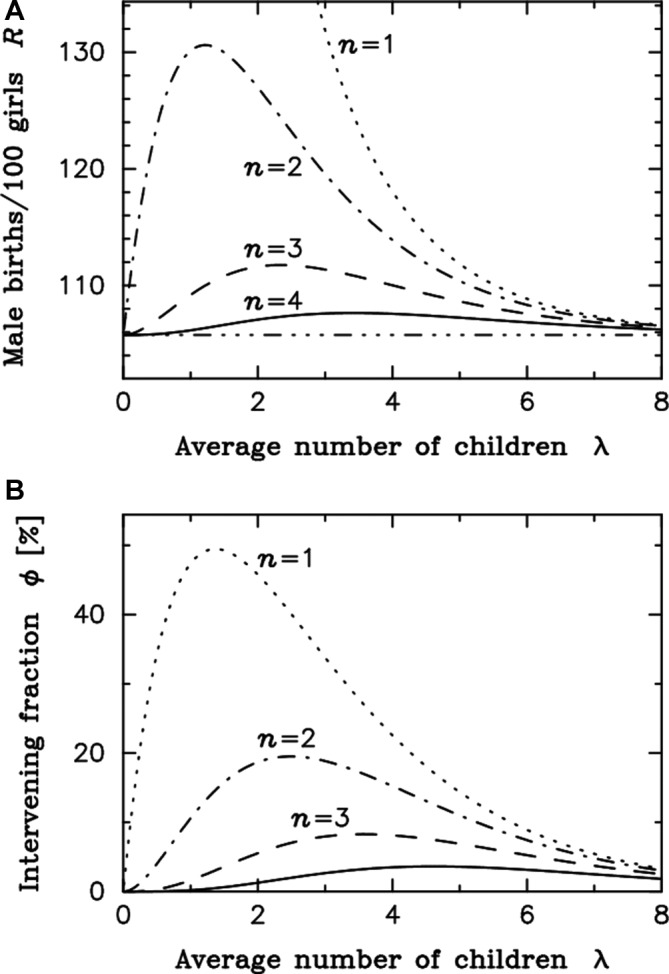
Figure 1.

The stopping rule model. (A,B) n is the minimum threshold (birth order) at which parents would use sex selection if necessary to ensure a son. Moving down from the top left-hand corner, the four curves show the cases for n=1 (dotted), n=2 (dot-dash), n=3 (dashed) and n=4 (solid). For instance, at minimum intervention threshold n=2, the distortion in the sex ratio at birth (R) is increasing continuously with a reduction in the average number of children in the population (λ) until it reaches its peak value of 130.6 boys per 100 girls at λ equal to 1.196. Below that point, there is increasingly less couples reaching the intervention threshold of two children, explaining that the sex ratio bias is decreasing. The fraction of intervening couples initially increases with fertility reduction to a maximum of 19.5% when reaching about 2.5 children in average before starting to decrease with further fertility reduction.
