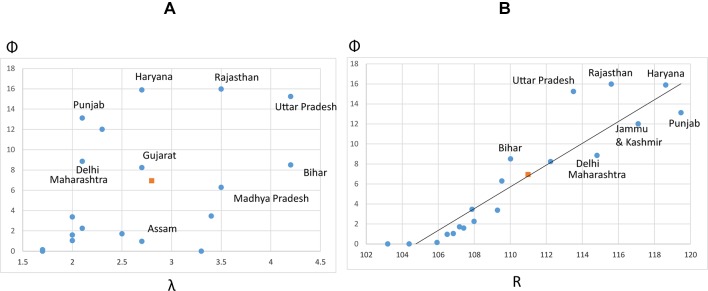
Figure 4.
Sex selection prevalence across the main Indian states, in relation to reported fertility level (total fertility rate; TFR) and SRB, 2005–2007. (A) Relationship between reported fertility level (λ) and calculated proportion of couples using sex selection (Φ). λ is estimated using reported period total fertility rates. (B) Relationship between the reported SRB for the main states of India in 2005–2007 with the proportion of couples using sex selection (Φ). The fitting line represents the expected values of Φ, given R, based on the average relationship between Φ and R across the main Indian states (solid dots). States above the fitting line (eg, Rajasthan, Uttar Pradesh) have a higher sex selection propensity Φ than expected given their reported SRB. Those below the fitting line have in contrast a lower measured Φ than expected considering their SRB. Indian averages in squares. Source: Indian Sample Registration System Statistical Report 2011, tables 15 and 16 (http://www.censusindia.gov.in/vital_statistics/SRS_Reports.html). SRB, sex ratio at birth.

