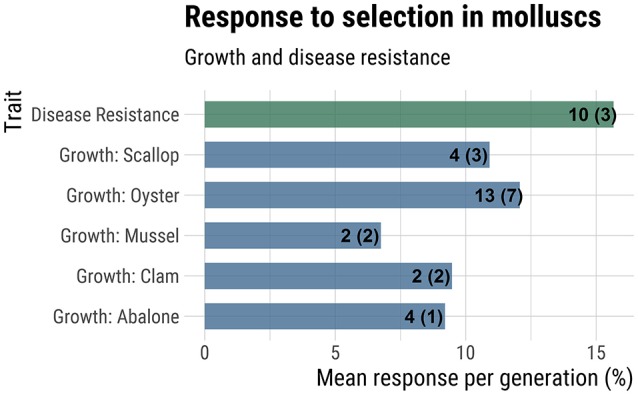
Figure 3.

Response to selection for growth and disease resistance. Mean response to selection (% increase in additive genetic value over base population mean) is reported on the x-axis. The numbers at the end of each bar indicate the total number of generations of selection used in the calculation and the number of studies considered (in parentheses). A more complete summary of the data collected can be found in Supplemental File 1, under the tab “Response to Selection”.
