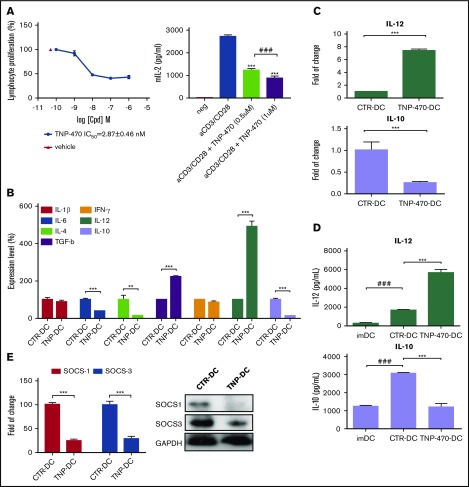
Figure 1.
TNP-470 potentiates DC immunogenicity upon LPS stimulation in vitro. (A) In vitro inhibitory effects of TNP-470 on T lymphocytes. Lymphocytes were and CD28 with different concentrations of TNP-470 for 72 hours. 3H-Thymidine was added 16 hours prior to sample harvest. Proliferation of T lymphocytes was evaluated by the level of incorporated 3H-thymidine. Representative data from 3 independent studies are shown (left). Data presented as mean ± standard error of the mean (SEM; n = 3). IL-2 secretion from lymphocytes upon CD3/CD28 stimulation (right). Lymphocytes were stimulated with anti-mouse CD3e and CD28 in the presence of vehicle/TNP-470 (0.5 and 1 µM) for 24 hours. Culture supernatant was harvested and detected for IL-2 secretion. Data presented as mean ± SEM (n = 3) from 2 independent studies. ***P < .001 compared with vehicle. ###P < .001 TNP-470 (0.5 µM) vs TNP-470 (1 µM). BMDCs upon vehicle and TNP-470 treatment (5 nM) were stimulated with LPS (200 ng/mL) for 4 hours to evaluate cytokine mRNA expression and for 16 hours to evaluate cytokine secretion. (B) Cytokine secretion profile of TNP-470/vehicle-treated DCs upon LPS stimulation. **P < .01 and ***P < .001 TNP-470–treated DCs (TNP-DC) vs vehicle-treated DCs (CTR-DC). Data presented as mean ± SEM from 2 independent experiment. (C) Fold-of-change in expression of IL-12 and IL-10 from BMDCs, which were normalized with GAPDH. Data presented as mean ± SEM from 3 independent experiment. ***P < .001 TNP-470 DC vs CTR-DC. (D) Cytokine IL-12 and IL-10 secretion from culture supernatant. Data presented as mean ± SEM from 5 independent experiment. ***P < .001 TNP-DC vs CTR-DC; ###P < .001 imDC vs CTR-DC. (E) BMDCs was stimulated with LPS for 4 hours to evaluate gene expression levels (left) and 8 hours to examine protein levels (right) of SOCS1 and SOCS3. ***P < .001 TNP-DC vs CTR-DC. Data presented as mean ± SEM from 2 independent experiment.

