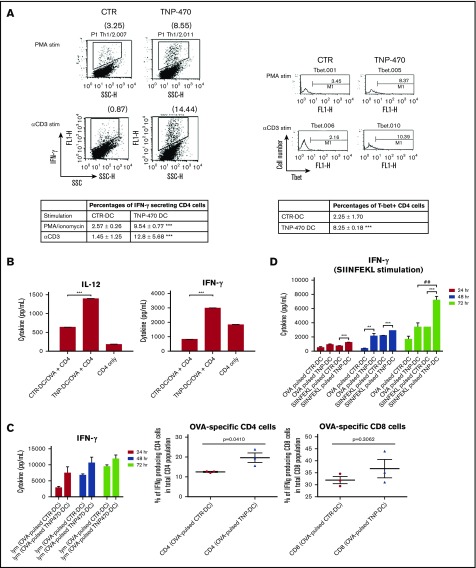
Figure 3.
TNP-470–treated DCs promote in vitro and in vivo Th1 polarization and induce strong CTL responses. Naive CD4 cells were primed with TNP-470/vehicle-treated DCs for 7 days. Primed CD4 cells were further stimulated with PMA (50 ng/mL) for 4 hours as mitogenic stimulation and anti-CD3e for 6 hours as TCR-mediated stimulation. Representative data of IFN-γ–producing CD4 cells and T-bet expressing CD4 cells by intracellular staining were showed (A, left) and percentages of corresponding cell population were summarized (A, right). ***P < .001 CD4 cells primed with TNP-DC vs CTR-DC. Data presented as mean ± SEM from 3 independent experiment. (B) In vitro OVA polarization assay. TNP-470/vehicle- treated and OVA-pulsed DCs were cultured with OVA-specific CD4 cells for 24 hours. Culture supernatant were detected for IL-12 (left) and IFN-γ (right) secretion. ***P < .001 Coculture of TNP-DCs and OVA-specific CD4 cells vs that of CTR-DCs and OVA-specific CD4 cells. Data presented as mean ± SEM from 3 independent experiment. (C) In vivo OVA polarization assay. C57BL mice were immunized with OVA-pulsed DCs (TNP-470/vehicle-treated) on day 0 and day 7. Lymphocytes from mice in different groups were harvested on day 14 and stimulated with OVA ex vivo. Culture supernatant from 24-, 48-, and 72-hour culture was detected for IFN-γ secretion (left). Data presented as mean ± SD from 3 independent experiment. Percentages of OVA-specific CD4 (middle) and CD8 cells (right) were quantified by flow cytometric analysis of IFN-γ+CD4+ and CD8+ cells upon 72 hours of ex vivo stimulation of OVA. Data presented as mean ± SD from 3 independent experiment. (D) OVA-specific CTL response. C57BL mice were immunized with OVA or OVA peptide (SIIFEKL)–pulsed DCs (TNP-470/vehicle- treated) on day 0, 7, and 14. Lymphocytes harvested on day 21 were stimulated with OVA peptide ex vivo and culture supernatant from 24-, 48-, and 72-hour culture was collected to detect IFN-γ secretion. **P < .01 and ***P < .001 TNP-DC vs CTR-DC (OVA /SIIFEKL-pulsed). ##P < .01 OVA-pulsed TNP-DC vs SIIFEKL-pulsed TNP-DC. Data presented as mean ± SD (n = 3).

