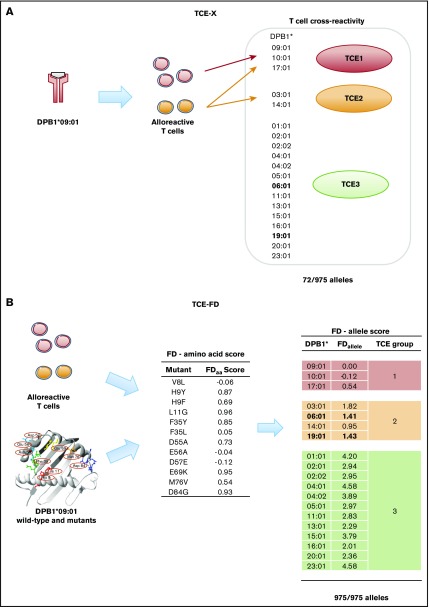
Figure 1.
TCE group classification of DPB1 alleles by TCE-X or TCE-FD. (A) TCE classification of DPB1 alleles based on in vitro cross-reactivity patterns of alloreactive T cells nominally directed against DPB1*09:01.26 Alleles that were reproducibly cross-recognized by a panel of 5 DPB1*09:01-specific alloreactive T-cell effectors were grouped together as TCE group 1 (red), whereas DPB1 alleles recognized by only a part or none of these T cells were classified into TCE groups 2 (orange) and 3 (green), respectively.26 In total, 72 of the 975 DPB1 alleles known to date were experimentally tested for TCE-X (see Supplemental Table 1 for a comprehensive list of TCE group assignment for these alleles). These 72 DPB1 alleles classifiable by TCE-X represent only 7.4% of all known DPB1 alleles and account for only 65% of the CWD alleles for this locus.33,34 Shown here are 19 DPB1 alleles reported with a frequency ≥ 0.5% in in a large population of European descent,68 which together make up 98% of the total DPB1 allele frequency. Two alleles (DPB1*06:01 and *19:01) that changed classification from TCE3 in TCE-X to TCE2 in TCE-FD are indicated in bold. (B) TCE classification of any known DPB1 allele based on in silico prediction by FD scores. The latter were experimentally obtained by generating a panel of 12 site-directed single amino acid mutants of DPB1*09:01 and assessing the median strength of recognition for each mutant by alloreactive T cells relative to wild-type DPB1*09:01.28 Based on this, the FD amino acid (FDaa) scores were calculated for each mutant, with high scores representing a high functional impact and low scores representing a low functional impact of the mutation. For each DPB1 allele, the sum of FDaa scores of each of the 12 polymorphic residues analyzed was used to calculate the FDallele score. Experimental TCE classification by TCE-X was found to reflect the range of FDallele scores as follows: TCE1, FDallele < 0.6; TCE2, 0.6 < FDallele < 2.0; and TCE3, FDallele > 2.0.28 TCE classification of the 19 DPB1 from panel A is indicated with TCE1, TCE2, and TCE3 in red, orange, and green, respectively. Two alleles (DPB1*06:01 and *19:01) that changed classification from TCE3 in TCE-X to TCE2 in TCE-FD are indicated in bold.

