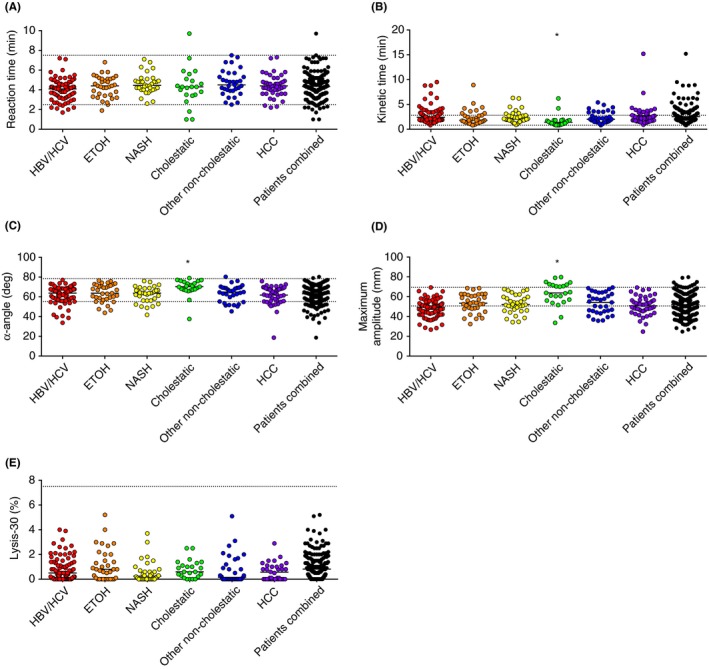
Figure 2.

Admission TEG parameters of patients with cirrhosis combined or subdivided by etiology of disease. (A) R‐time, (B) K‐time, (C) α‐Angle, (D) Maximum Amplitude (MA) and (E) Lysis‐30. Reaction and K‐time are expressed in minutes, α‐Angle in degrees, MA in millimeter and Lysis‐30 in percentage of clot lysed 30 minutes after reaching MA. Horizontal bars represent medians. *P<.05 in comparison with each group of non‐cholestatic patients. Grid lines indicate the upper and lower limit of the normal range
