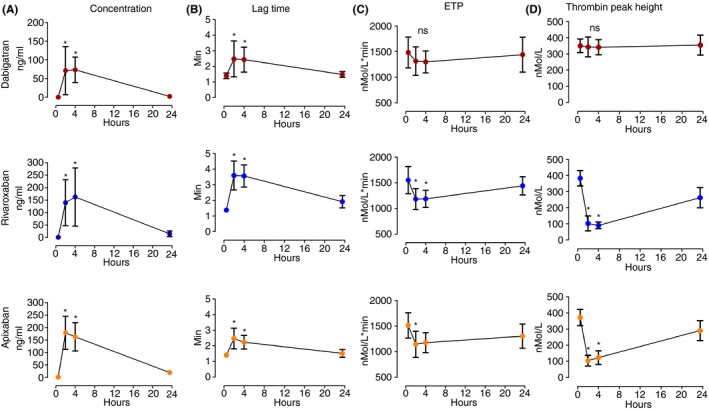
Figure 1.

The DOAC concentrations and the effect on TGA parameters, lag time, ETP, and thrombin peak height over time after intake of single dose of DOACs. ETP, Endogenous Thrombin Potential; ns, not significant. *indicates p value of <.05 compared to baseline level at time 0. The bars represent mean ± standard deviation
