
Figure 4.
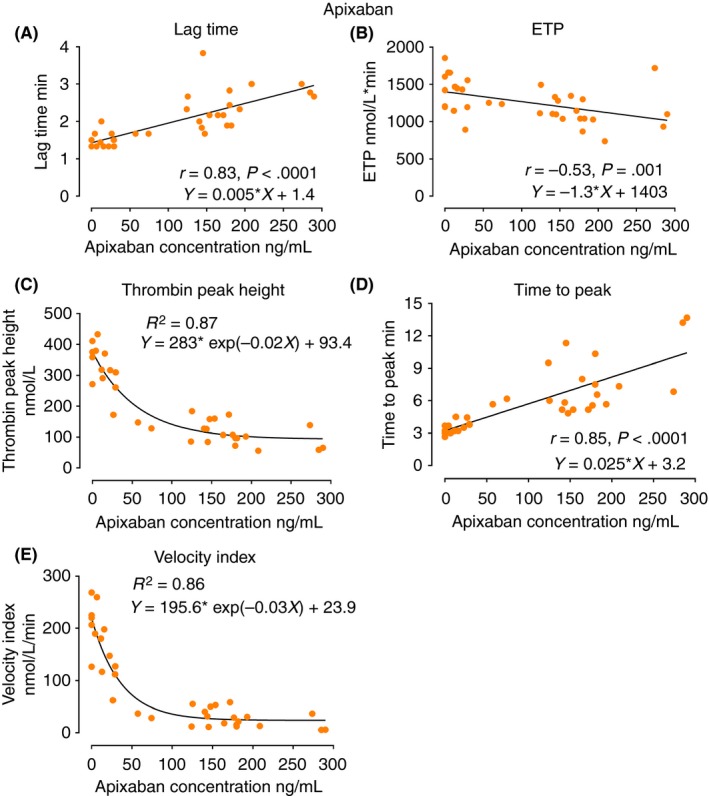
The scatter diagrams of TGA parameters, lag time, ETP, thrombin peak height, time to peak, and velocity index against apixaban concentrations. The Spearman correlation coefficient r as well as the regression equations are indicated in the diagrams. ETP, endogenous thrombin potential