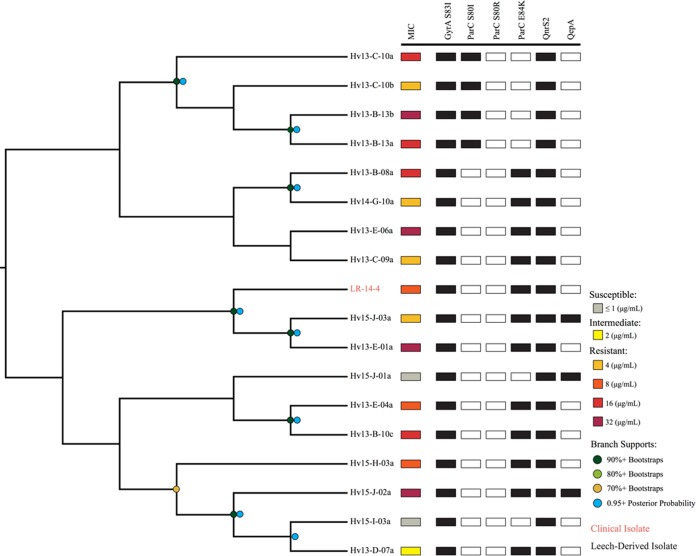
FIG 5 .
Phylogenetic reconstruction of the AvCp group. This cladogram is a maximum likelihood reconstruction generated from whole-genome alignments. Bootstrap support values are represented by dots: dark green, 90%+ bootstraps; light green, 80%+; khaki, 70%+. Posterior probabilities of 95%+ from a Bayesian inference are represented by blue dots, and branch lengths do not carry meaning. Resistance levels are indicated by colored boxes: susceptible, ≤1 µg/ml (gray); intermediate, 2 µg/ml (yellow); resistant, 4 µg/ml (orange), 8 µg/ml (dark orange), 16 µg/ml (red), and 32 µg/ml (dark red). The presence of Cpr-conferring genes and mutations is shown by filled black squares. The names of taxa derived from clinical isolates are colored in orange.

