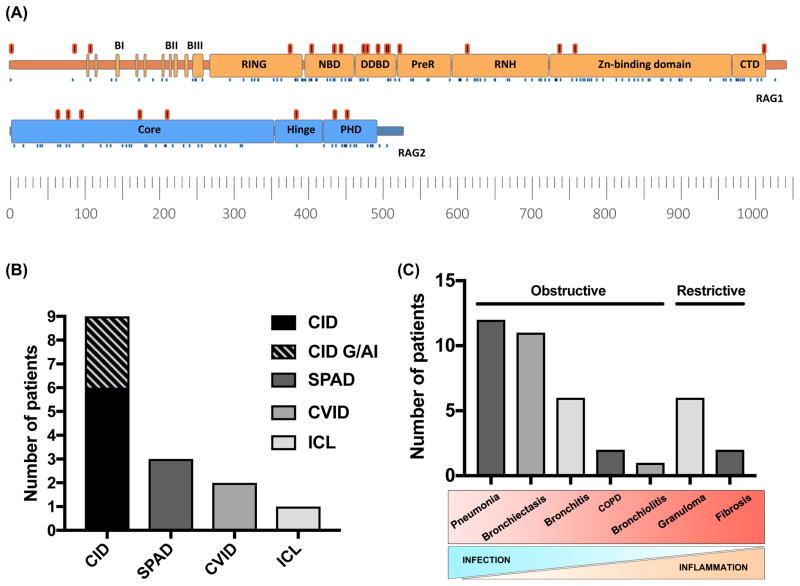
Figure 1. Gene variants and phenotypes of adults with RAG deficiency.
(A) Schematic representation of RAG1 and RAG2 adapted from Notarangelo et al. 2016 (ref E19). Variants in this cohort (17 in RAG1 and 8 in RAG2) are illustrated in red. Known pathogenic variants previously reviewed are shown as blue dots (ref E19). (B) The phenotypes of RAG deficiency in 15 patients including those from the NIHRBR-RD PID and Vienna cohort. (C) Presentation of lung disease. Bars represent age distribution, lines indicate median onset of lung disease, mean age of death, mean age (n=15).

