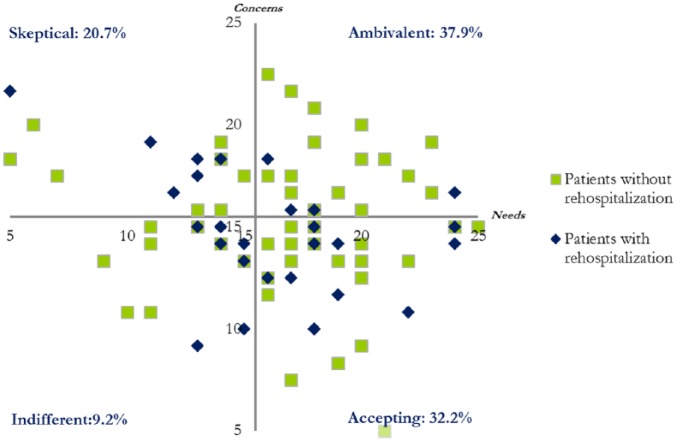
Figure 1.
This scatter plot shows the distribution of patient’s scores of the BMQ (Beliefs about Medicine Questionnaire) specific statements in the four belief groups: accepting, ambivalent, skeptical, and indifferent.
The x axis represents the scores of the necessity subscale and the y axis the scores of the concerns subscale.

