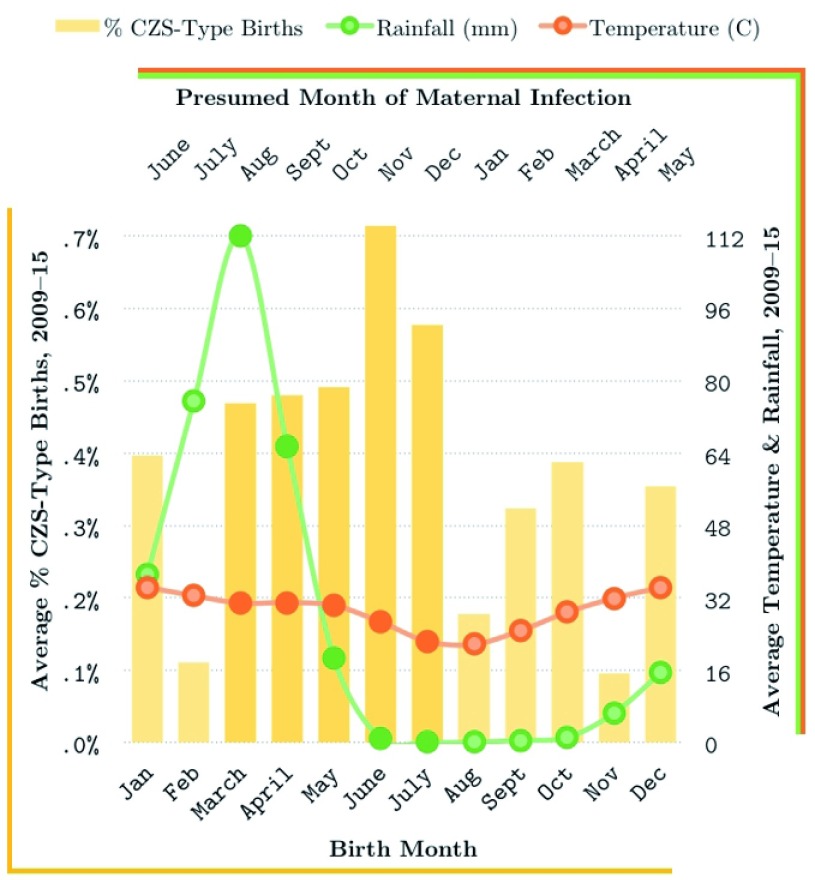
Figure 1. Average birth defects consistent with congenital Zika syndrome per month, with corresponding average daily temperatures and rainfall during presumed maternal month of infection.
Bottom axis corresponds with the birth month depicted with yellow bars (i.e., with the left scale that shows % CZS defects), while the top axis corresponds with the month of maternal infection (and thus, with the rainfall and temperature shown on the left, depicted in green and red, respectively).

