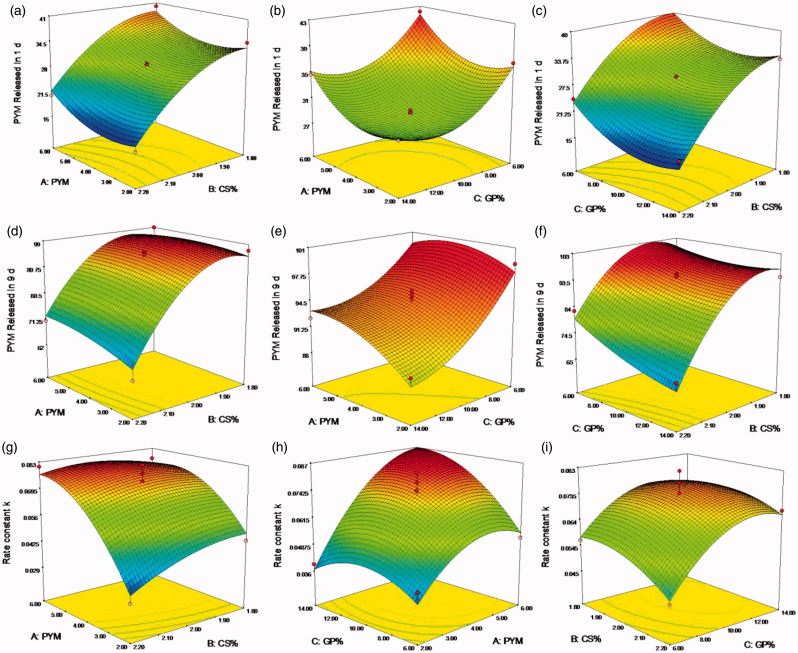
Figure 3.
(a–i) Response surface plots showed the effects of X1(A), X2(B) and X3(C) on the response Y1, Y2 and Y3. X1 is the factor of concentration of PYM, X2 is the factor of CS amount, X3 is the factor of GP content, Y1 is the response of cumulative release percentage of PYM in 1 day, Y2 is the response of cumulative release percentage of PYM in 9 days, Y3 is the response of rate constant k.

