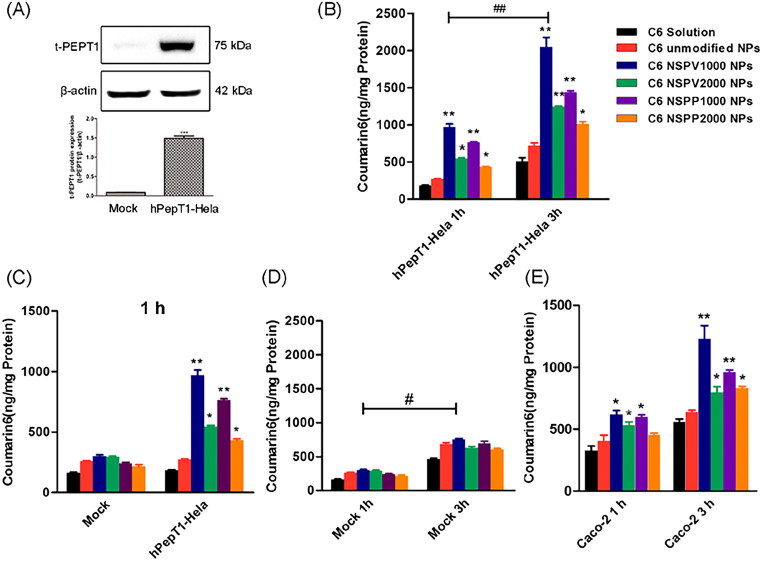
Figure 3.
(A) Protein expression of PepT1 in stably transfected hPepT1-Hela and mock-Hela cell lines; Cellular uptake of C6 solution and C6-loaded unmodified NPs, NSPV1000 NPs, NSPV2000 NPs, NSPP1000 NPs, and NSPP2000 NPs in hPepT1-Hela cells for 1 and 3 h (B), in mock-Hela and hPepT1-Hela cells for 1 h each (C), in mock-Hela cells for 1 and 3 h (D), and in Caco-2 cells for 1 and 3h (E), respectively. Data are shown as mean ± SD. *p < .05, **p < .01 vs. cellular uptake of C6 solution group at the same time point, #p < .05, ##p < .01 vs. corresponding cellular uptake of each group at 1h, n = 3.

