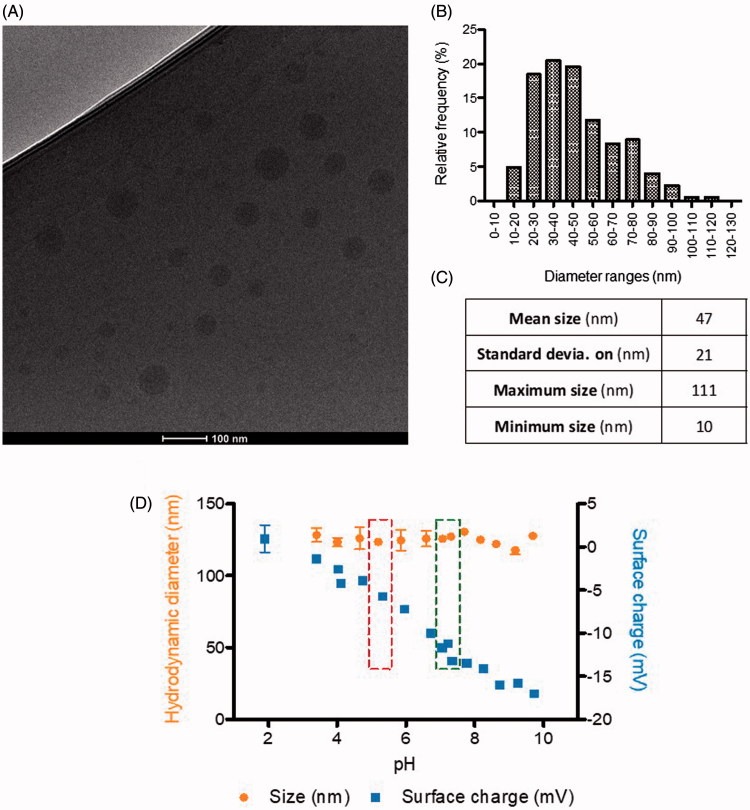
Figure 2.
Physicochemical characterization of nanoparticles size, surface charge, and morphology: (A) CryoTEM micrography; –(B) Histogram of nanoparticles size distribution, by CryoTEM; –(C) Statistical analysis of sizes by CryoTEM (n = 704 nanoparticles analyzed, from different images and samples); and –(D) Hydrodynamic diameter (nm) and surface charge (mV) of nanoparticles, by DLS, as a function of pH (Left box, storage pH; right box, physiological blood pH).

