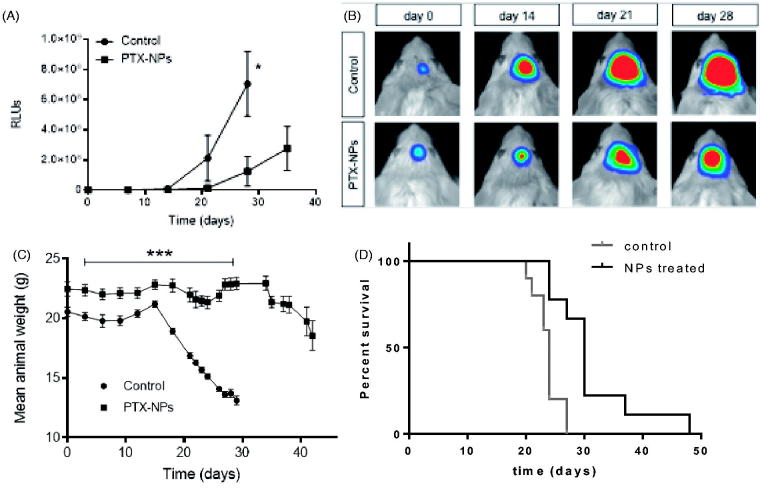
Figure 5.
–(A) Growth of luciferase expressing U87-MG tumors in live mice intravenously treated with either PTX-loaded NP or empty NPs, (*p < .05; n = 10); –(B) Bioluminescence images of tumors showing Pluc-G-U87-MG cells activity at days 7, 14, 21, and 28 from representative mice in each group. Pseudo-color images are superimposed on black and white dorsal images of the corresponding animal. Light intensity is represented by an arbitrary color scale (center-bright = high, darkborders = low). –(C) Mean animals weight as a function of treatment time (***p < .001; n = 10). –(D) Kaplan-Meyer curves summarizing mice survival. Log-rank (Mantel-Cox) test; (p = .001; n = 10). Treatment schedule: injection every three days up to day 21.

