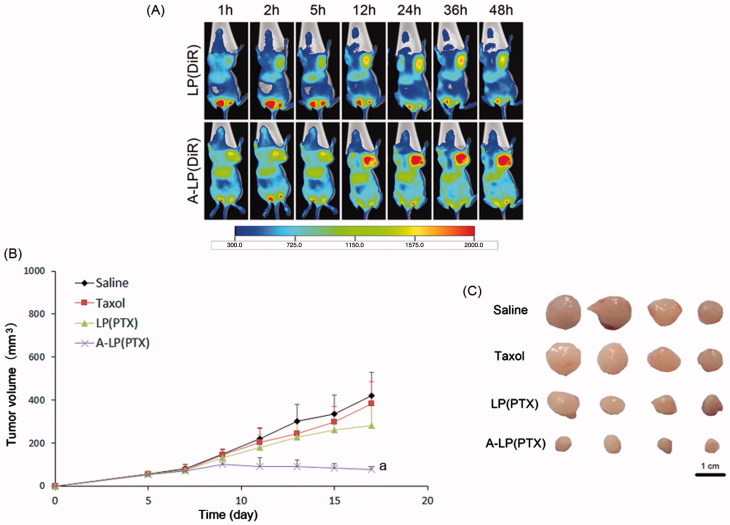
Figure 6.
(A) In vivo fluorescent images of tumor bearing mice at different time points after i.v. injection of LP (DiR) or A-LP (DiR). (B) Tumor growth curve of MCF7 PTX-R cells baring nude mice treated with saline, Taxol, LP (PTX) or A-LP (PTX). a, p < .05 versus saline, Taxol or LP (PTX) formulation. (C) Photograph of the tumors excised at the end of the test. Scale bar =1 cm.

