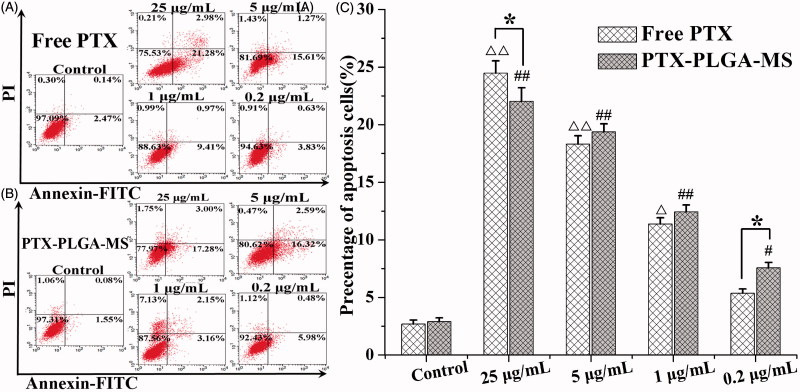
Figure 4.
Apoptosis analysis of U251 cells induced by (A) free PTX and (B) rough PTX-PLGA-MS with different concentrations of PTX (25, 5, 1, and 0.2 μg/mL, respectively) for 48 h using flow cytometry. (C) The bar graphs show the percentage of cell apoptosis with different treatments. △, # vs. control group, △, *,#p < .05, and △△, ##p < .02.

