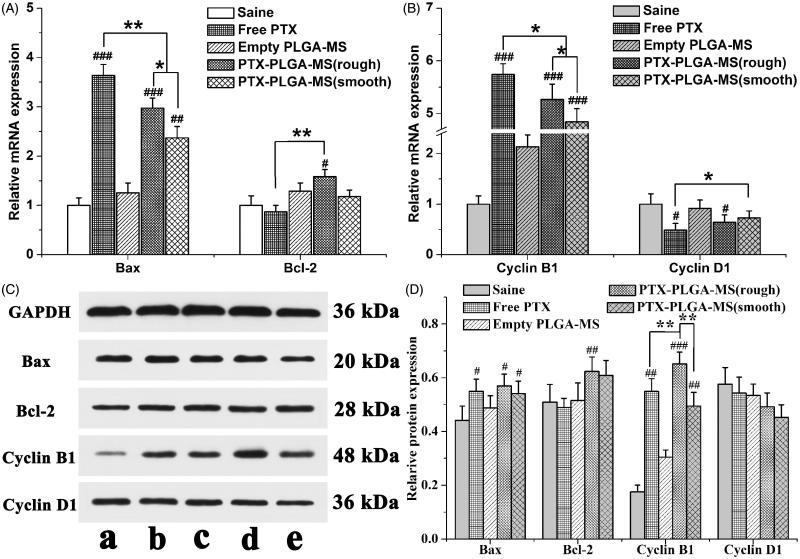
Figure 6.
Molecular biological analysis of liver tumors receiving different treatments. Relative (A) Bax/Bcl-2 and (B) Cyclin B1/Cyclin D1 mRNA expression changes in liver tumors were analyzed by PCR. GAPDH was used as an internal reference. (C) Effects of saline, free PTX, empty PLGA-MS,) rough PTX-PLGA-MS, and smooth PTX-PLGA-MS on proteins expression in liver tumors. (D) Quantitative evaluation on proteins expression were further analyzed by densitometry. # vs. saline group; *, #p < .05; **, ##p < .02; and ###p < .01.

