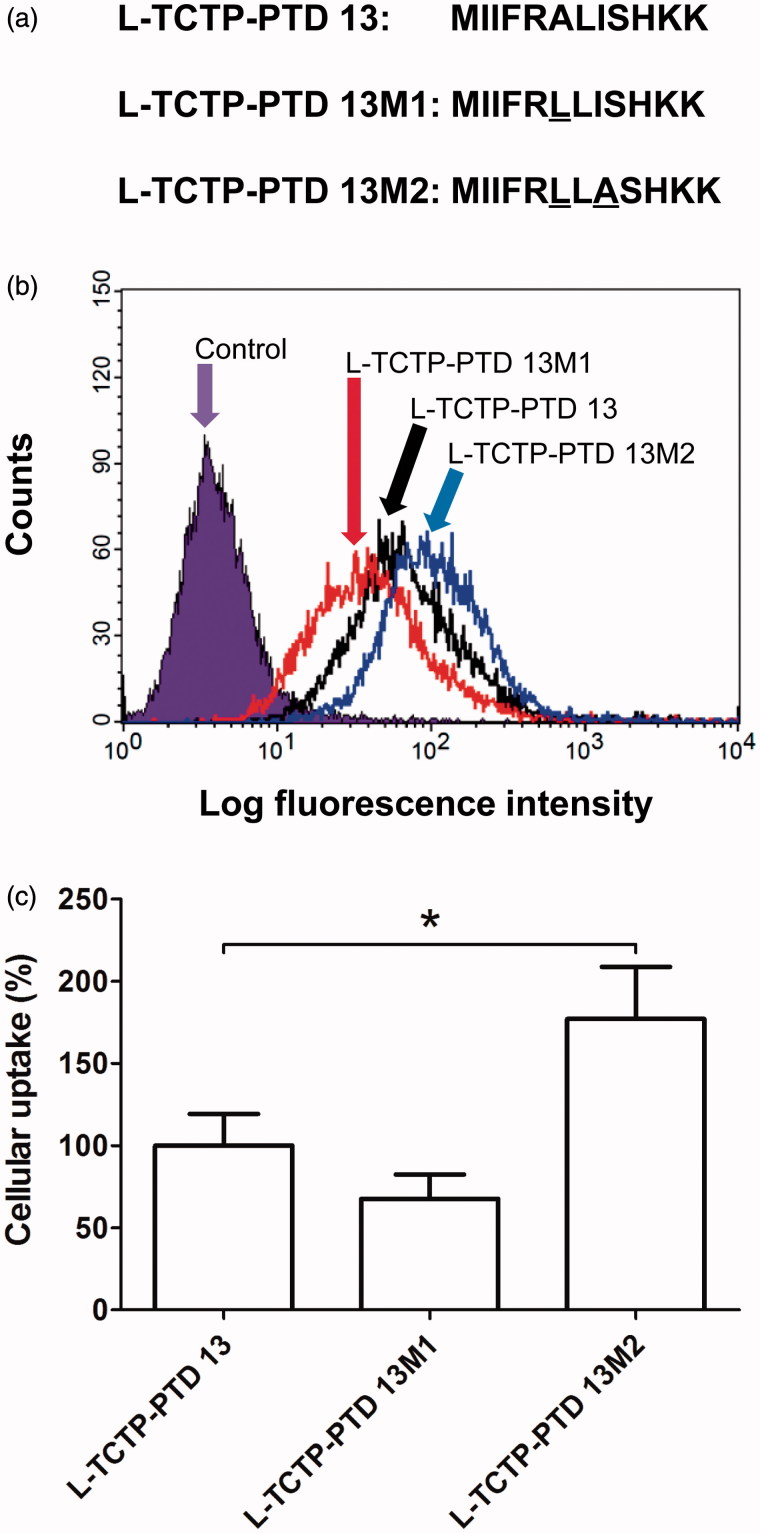
Figure 1.
(a) Amino acid sequence of l-TCTP-PTD 13 and its analogs. Amino acid modifications in l-TCTP-PTD 13 are underlined. (b) Cellular uptake of FITC-labeled peptides in BEAS-2B cells analyzed by a flow cytometer. (c) Histograms of l-TCTP-PTD 13, l-TCTP-PTD 13M1, and l-TCTP-PTD 13M2. Each bar represents the standard deviation of three independent replicates. The mean fluorescence intensity of FITC-labeled l-TCTP-PTD 13 in BEAS-2B cells was set to 100%. *p < .05 versus FITC-labeled l-TCTP-PTD 13.

